


*This is a snapshot of the data available in the full Industry Report! Click here to order your copy.
Adventure Park Insider has conducted an industry-wide survey to measure current and future trends. We collected data from 152 operators across North America—85% of whom were high-level managers or owners of their parks. All answered our questions to the best of their ability. Guest Research Inc., a market research firm, assisted us in analyzing the results. Despite the small sample size, the survey reveals several unmistakable trends. In future years, we hope to generate a greater response and provide a more comprehensive picture.
Here’s what we found.
PHYSICAL AND OPERATIONAL CHARACTERISTICS
The growth of pay-to-play parks has created two distinct segments in the industry, each with its own unique structure: the traditional challenge course programs that are developmental, therapeutic, or educationally focused; and the commercial, recreational, pay-to-play aerial adventure parks.
Consequently, we have separated the data points into these two categories, experiential and pay-to-play (P2P). Experiential respondents made up 40% of our sample, and pay-to-play made up the remaining 60%.
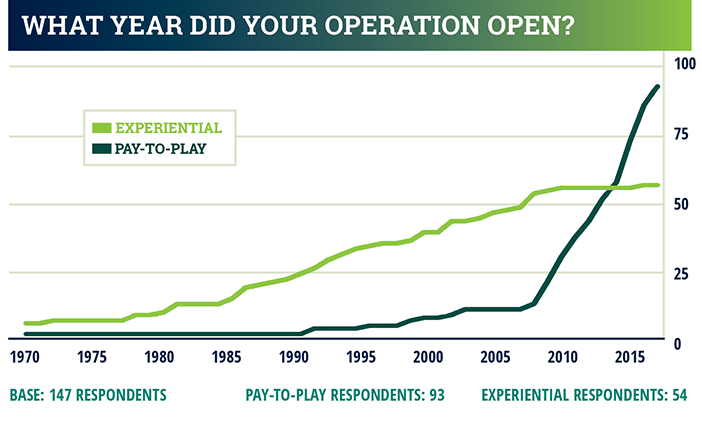
Experiential operations saw strong growth starting in the 1970s; our sample shows steady growth through the mid-’00s. The largest growth in this segment in the past decade, at least among our respondents, has been in therapeutic applications, with the addition of ropes courses and zip lines to counseling centers, psychiatric hospitals, and behavioral health operations.
The P2P side of the industry began, in a very small way, with zip lines in the 1990s, and experienced steady growth as both the industry and consumers explored a new avenue for adventure and thrill-seeking. Aerial adventure parks first appeared in the early 2000s, and they are continuing to grow fast; 38% of P2P respondents got their start in the last four years alone.
Activities Offered
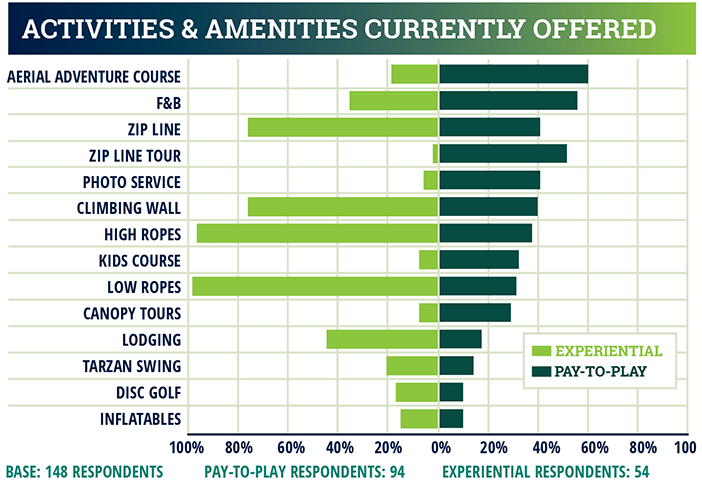
Both segments comprise a range of activities. The largest growth area industry-wide has been in aerial parks and challenge courses. These are the most commonly offered activity among our P2P respondents, and rank 8th among experiential operations. We should note, though, that zip line/zip tour/canopy tours combined are at least as widespread among respondents as aerial parks.
Respondents have an average of three aerial courses, with an average of 39 elements on site—an average of 54 elements for P2P operations, and 21 for experiential programs.
Zip lines and zip line tours are also widespread: respondents have an average of eight zip lines, with participants reaching an estimated average speed of 37.5 mph.
Beyond that, respondents offer a range of activities, such as target sports, mechanical bull-riding, geo-cacheing, kayaking and whitewater rafting, cavern tours, mining sluices, and laser tag, among others.
Belay Systems
Challenge courses and aerial parks use a variety of belay systems, and these reflect some key differences between experiential and pay-to-play operations.
With their often self-guided courses, 86% of P2P respondents use a continuous or smart belay system, with the remaining 15% using lobster claws. Some operators use a combination of the two—continuous or smart belay system for participants, and lobster claws for guide use—to allow more flexible travel through the course as necessary.
Experiential respondents paint a much different picture: 69% use lobster claws, 51% rely on dynamic belay systems, and only 8% use continuous belays.
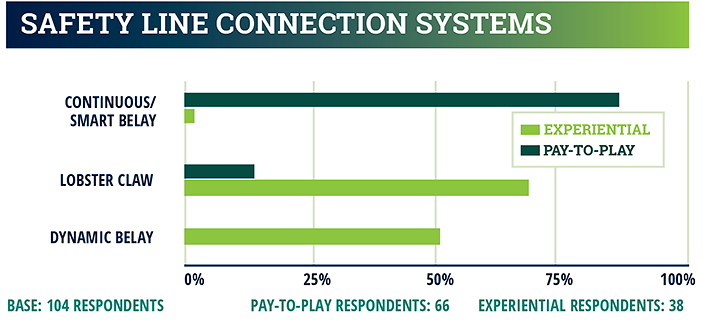
These differences stem from both the very different aims of the two types of businesses, as well as the structure of their courses and programs. Experiential operations offer primarily low and high ropes activities, which can necessitate the use of multiple belay systems. Dynamic belay systems, especially on high ropes courses, are designed to foster trust between teambuilding participants.
This helps explain why experiential operations rate “increased regulations” as a top worry for the future. Dynamic belays and lobster claws are integral to the educational process, yet the greatest level of security in the P2P world comes from the use of continuous and smart belays, which reduce the chance for guests to disengage from the belay system. If regulators were to require continuous or smart belays for all types of aerial activities, that would negate much of the educational/experiential value of challenge courses.
[To read more about belay systems check out this article “On Belay Systems”]
BUSINESS VOLUME AND DEMOGRAPHICS
The industry is growing not only in the explosion of new P2P operations, but in visitation at individual parks and programs as well.
P2P businesses see greater numbers of visitors, on average, and volumes are growing faster than for experiential/educational operations. Respondents as a whole have experienced 18% growth since 2013. Individual P2P operations experienced 25% growth over the past three years; experiential operations, 9%.
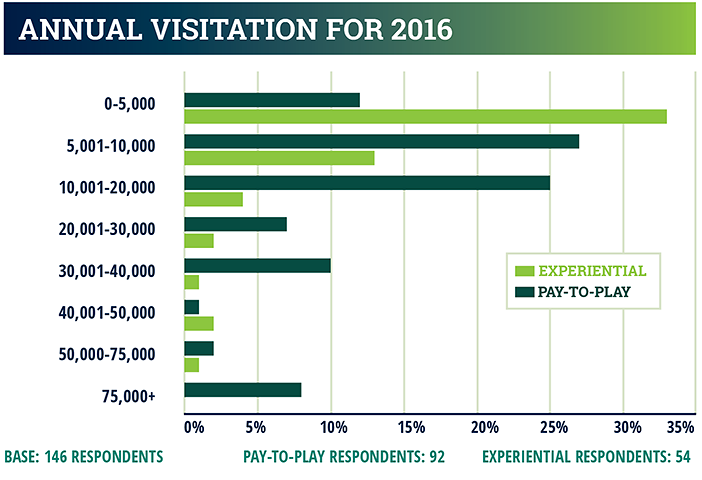
The biggest growth area in the P2P arena for visitation has been in small- to mid-sized parks that draw 5,000 to 20,000 visitors a year. However, a growing number of parks are seeing volumes of 30,000 or more; the number of parks with visitation volumes exceeding 75,000 has doubled since 2013.
A large percentage of respondents at experiential operations, in contrast, see less than 5,000 annual visits. The largest growth has been in the number of experiential programs in the 5,000 to 10,000 range, up 27% since 2013.
Both sides of the industry are predicting continued growth in 2017, with P2P respondents predicting average growth of 17%, and experiential operations predicting growth of 9%.
Who’s most interested in playing in the air? The largest age ranges for participation are 13-17, 18-24, and 25-34 in both the P2P and experiential sectors. The biggest growth markets for P2P, though, are younger participants ages 2-5, and adults 55+. For P2P operations especially, having options that appeal to multiple generations, and marketing them in a way that appeals to all ages, will be a key to future growth. That helps explain the growing importance of alternate activities, such as climbing walls and kids-specific aerial courses. These are among the items operators are planning to add in the near future.
[What do you do with the youngest of guests? Check out “Kids Park Here” for some great ideas!]
FINANCIAL METRICS
P2P operations average $900,000 in annual revenue (see chart below). Thirty-eight percent of respondents ring between $100,000 and $500,000 per year, while 55% are grossing $500,000 or more. Twenty-nine percent of respondents are bringing in more than $1.5 million, reflective of the growing number of parks with visitor volumes greater than 30,000 a year.
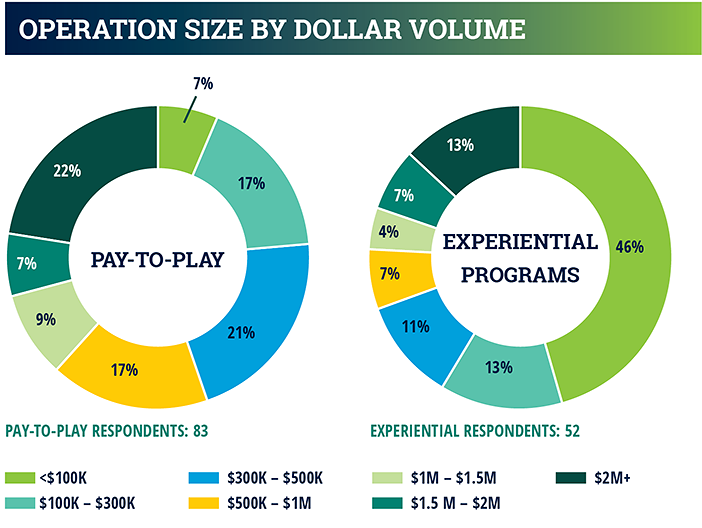
The experiential market has a heavy concentration of smaller operations; 46% of respondents report revenue under $100,000. Another 13% show revenues between $100,000 and $300,000. These relatively low revenues may reflect our sample’s preponderance of smaller camps and seasonal programs, many of which are non-profits; 84% of experiential respondents identified as a non-profit organization. But not all educational programs are small: 20% of experiential respondents, including several religious organizations, report revenues exceeding $1.5 million.
The differences in the business models for P2P and experiential programs show up in other ways, too. Pricing structures, for example.
In the P2P segment, 74% of respondents offer either a-la-carte pricing or the option of a-la-carte and all-inclusive tickets. In contrast, 58% of experiential respondents offer only an all-inclusive option, while 27% offer both a-la-carte and all-inclusive. That reflects the more structured programs of the experiential world.
Revenue sources (see chart below) also show some decided differences. P2P respondents indicated that course admissions were their top source of revenue, with ancillary revenue coming from retail, food and beverage, and photo services. Multi-activity packages and events, both of which aim to drive attendance and make parks “sticky,” are also important aspects of the business. It’s likely that, as adventure parks mature, ancillary services will become more important to guests, and a greater source of income.
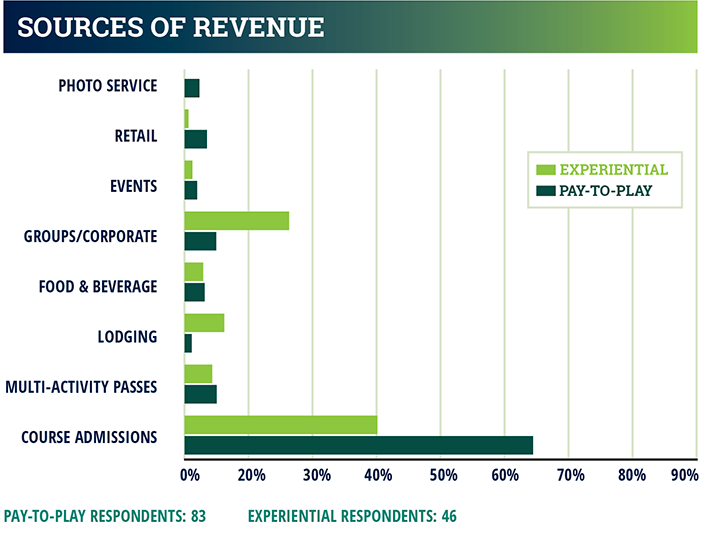
Note that while ancillary revenues from photo services, retail and events appears relatively low, not all operations offer these services. Among those with photo services, for example, the majority say revenues are 10% or more of total revenues.
[Photo services are springing up across the industry. For more info check out “Get the Picture?”]
Course admissions also ranked as the number one source of revenue for experiential operations, but corporate and group sales are much more important than in the P2P arena. The same is true for lodging, as many educational programs are multi-day programs where participants stay on-site.
Experiential and educational programs generally do less business in souvenirs and keepsakes. It would appear there is market potential in ancillary services such as photos and souvenirs, as HR departments and other groups might well appreciate mementos of their experiences as much as adventure park guests do.
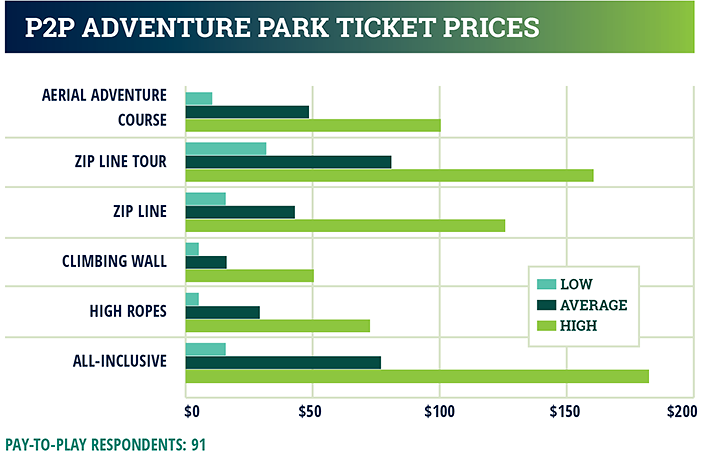
All that said, the overall prices both types of businesses charge are surprisingly similar. Our experiential respondents’ all-inclusive packages range from $15 to $200, with an average price of $67 per participant. The pay-to-play operators are offering all-inclusive rates of $15 to $185, with an average of $72.50 per participant.
[For all the info on souvenirs, read “Cashing in on the Extras”]
Staffing levels show that P2P operations tend to have larger staffs, which reflects the greater number of participants they host.
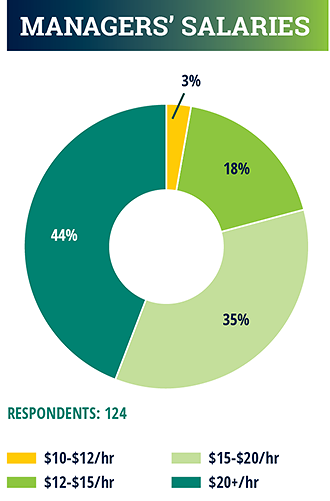 When it comes to salaries, though, the P2P and experiential segments offer very similar salary structures. We’ve shown managers’ salaries here, with 44% of respondents in both categories paying managers $20 an hour or more. But the story is much the same for guides, supervisors, and other staff.
LOOKING AHEAD
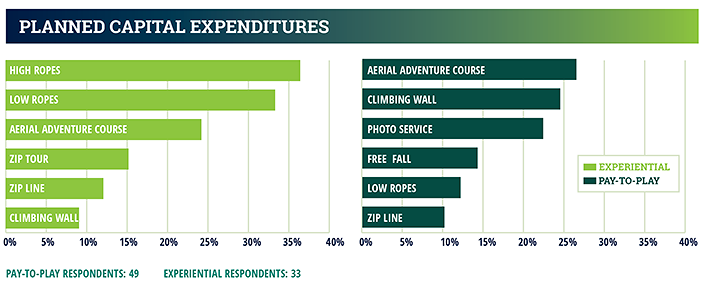
Forty-three percent of respondents are planning capital expenditures for the 2017 season; another 38% said they had not decided at survey time.
Aerial courses are the most popular planned addition, at 25% across both sectors of the industry. But operators are looking for a greater variety of activities to offer. In the P2P world, as operations reach peak volumes for their primary activity, revenue growth potential will fall squarely in the ancillary activities and services such as photography, retail, and high-throughput, low-cost activities such as climbing.
[Climbing walls are becoming increasingly popular, read more in Park 360’s: “Climbing Right”]
In the experiential segment, 36% of respondents are planning to add high ropes elements, and another 24% plan to add an aerial adventure course.
With growing competition on both sides of the market, operators will increasingly seek ways to make their activities as inclusive as possible, expand the experience with ancillary services and high-throughput, low-cost activities, and manage consumer expectations and concerns as it relates to regulations, incidents, and safety.

