


SPONSORED BY:

We tallied more than 100 respondents at press time, roughly half the estimated total that will be included in our final report. Of these, 59 are pay-to-play operators, and 44 traditional. More than 75% of the respondents are high-level owners or managers. While the results described here are preliminary, they reveal some key trends that we will explore further in the full report. The full report will be available with the mailing of the Spring/Summer 2018 issue.
Business varied widely for pay-to-play and experiential operations over the past year, according to Adventure Park Insider’s second annual industry-wide survey. While overall, operators mostly saw single-digit increases in revenues and visits, individual operations reported increases or declines up to 20 percent or more. The results highlight the rapid changes and evolution that the industry continues to experience.
As in last year’s report, we segmented respondents into two general groups, pay-to-play (P2P)—commercially and recreationally focused businesses—and traditional—programs that are developmental, therapeutic, or educationally-focused in nature.
Here’s a look at the major trends and information we gathered so far.
VISITATION
Visitation for both P2P and traditional programs rose in 2017, on average.
For the 40 P2P operators who reported visitation totals for this year and last, visitation increased 6% year-over-year. But visitation among them varied widely, from a 20% decrease to a 20% increase.
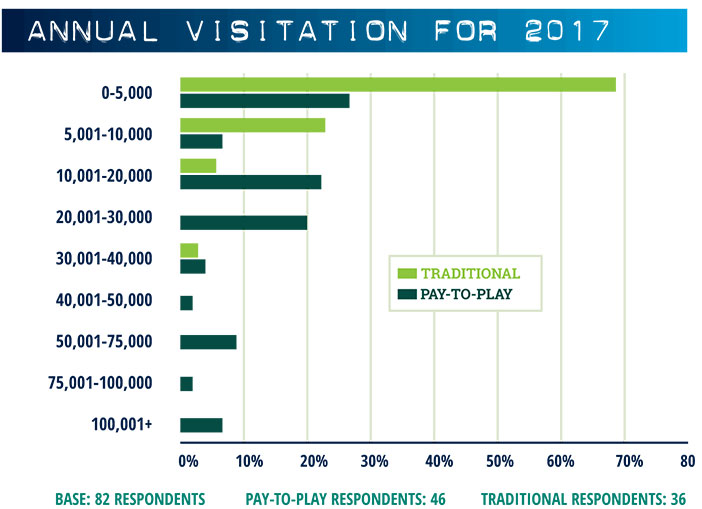
For the 29 traditional operations that reported visitation totals for both years, the reported increase is 9%.
On another positive note, return visitation increased on both sides of the industry. The percentage of return visitors rose six points, to 26%, for P2P operators, and was up nine points for traditional programs, to 49%.
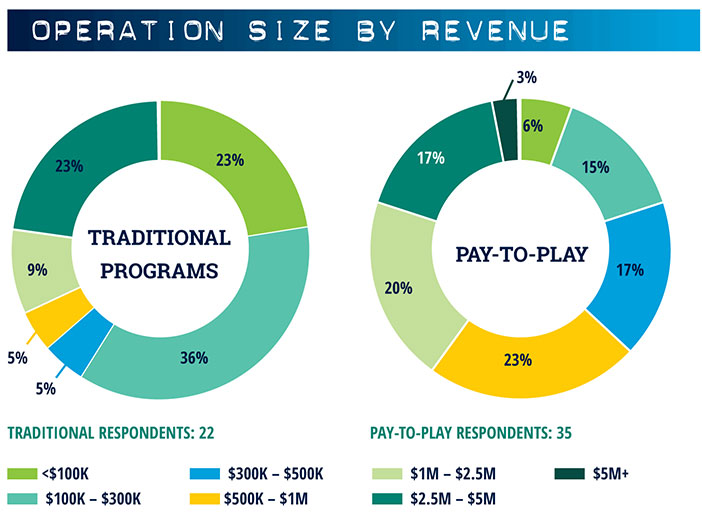
REVENUE
Revenues were mostly flat for both types of operations, based on preliminary analysis. However, we asked operators to report revenues in set ranges in 2016, and to provide more precise numbers in 2017, so specific comparisons are difficult to make. Near as we can tell, in comparing the10 traditional and 15 P2P operations that reported revenues for both years, traditional respondents reported an average 4% increase in revenue, while P2P operations reported a 2% decline. Both differences are well within the margin of error, though.
For traditional operations, revenues from lodging, food & beverage, and/or retail could help account for an increase in revenue, as all these categories were offered at an increased number of operations compared to the previous year.
P2P operations that reported for both years saw a decrease in revenue per visitor, from $60 to $56. We will watch to see if this changes in the full report, and also explore the revenue story for all revenue sources.
ACTIVITIES AND AMENITIES
The main formulas for adventure parks and traditional programs are pretty well set. Adventure parks feature either a zip line, zip tour, or aerial adventure courses. Traditional programs lean heavily on high and low ropes courses.
P2P operations continue to expand the range of complementary activities they offer. The biggest growth categories are kids courses, climbing walls, and free fall devices, as operators round out their businesses. Disc golf was another fast-growing category among this year’s respondents. It’s clear that P2P operators are expanding their range of activities, both high-thrill and low-thrill, to appeal to a wider, family audience.
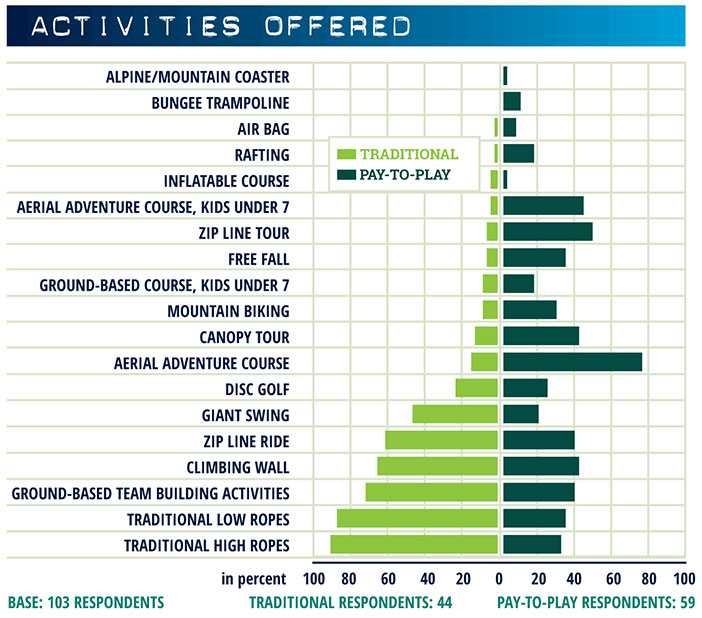
Many P2P operations are beginning to blur the line between traditional and P2P formats by offering traditional team-building challenges, either ground-based or traditional high and low ropes courses. (See “Adventure Rec. Vs. Adventure Ed,” p. 68, for more on this trend.) This suggests a need for consumer education on the difference between “team building” and “team bonding.”
In traditional operations, high and low ropes courses are typically augmented by zip lines, climbing walls, and giant swings. Zip lines are the fifth-most-commonly offered activity, but are the third-most-frequently visited, demonstrating the activity’s popularity.
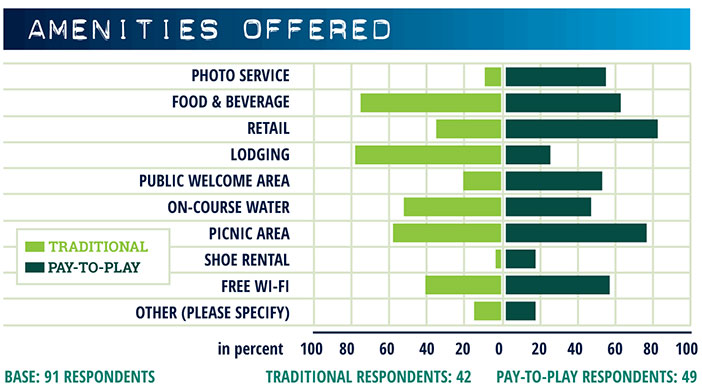
Amenities can be another source of revenue, and more and more P2P operators are adding these. In the past year, the number of operations with photo services has increased by 15 percentage points; more than half of our responding P2P operators now offer photo services. These services account for an average of 8% of overall revenues, but can be as much as 25% of total revenue. (See “A Snapshot of Photo Systems,” p. 58, for more on photo services.)
Other popular amenities include food and beverage and retail, and free services such as on-course water, picnic areas, and Wi-Fi. Shoe rental is also showing up more frequently.
EMERGENCY ARREST DEVICES
Another item that zip line operators are addressing is their equipment. In the past year, there was a flurry of activity and inquiry regarding back-up braking systems, also known as emergency arrest devices (EAD). Among the survey respondents, 57% of P2P operators and 53% of traditional operators have some sort of emergency arrest system, including Prusik brakes, brake blocks, spring banks, or eddy-current brakes. Some respondents commented that they are reviewing their systems with an eye toward upgrading them.
INJURIES & INCIDENTS
Major injuries, incidents, and near misses get attention in the mainstream media, as we’ve seen over the past two years, but how common are they? We asked respondents to rank the most common types of injuries they see at their operation. Roughly 90% of P2P and traditional operators ranked scrapes, minor lacerations, and bruises as the most commonly seen injuries, followed by sprains. Other common injuries seen include rope burns and insect bites/stings.
The most common causes of injury are slips and falls, and—especially for injuries to guides—guide error, according to respondents. While it’s impossible to eliminate all incidents, staff training can play a key role in reducing the frequency and severity of incidents, for both guests and staff.
Once the survey is complete, we will perform a more in-depth analysis of the data on injuries and report on any significant findings.
FUTURE PLANS
A majority of existing operations—55% of P2P respondents and 51% of experiential programs—are making capital investments to attract new visitation, increase repeat visitation, and keep their activity lineup fresh. An additional 32% of P2P respondents and 16% of traditional operations were still considering possible capital expenditures at survey time in mid-November.
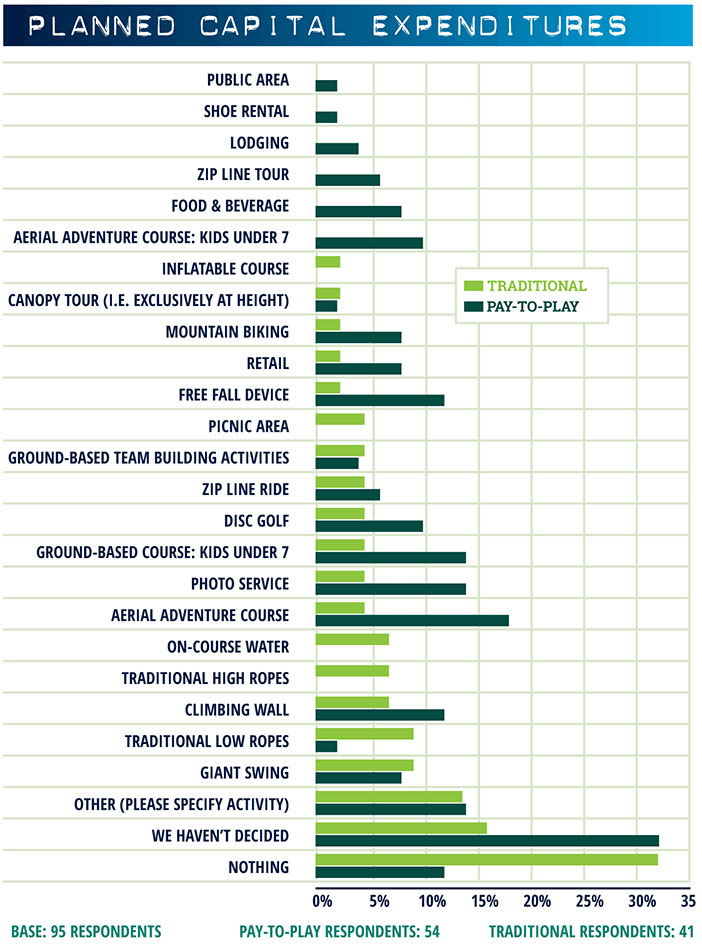
While aerial adventure courses remain the number one planned addition, operators are increasingly looking to add ancillary activities and amenities to increase time spent on site, increase spend per visitor, and to appeal to wider audiences. Topping the list of planned amenities for P2P parks are climbing walls, free fall devices, photo services, disc golf, and offerings for children under the age of 7. Traditional operators are planning to add items such as giant swings, climbing walls, and traditional low-ropes elements. Both groups of operators are planning updates to existing infrastructure.
FUTURE CONCERNS
All these expenditures come as both P2P and experiential operations prepare for more competition and worry about consumer confidence. Operators in both camps ranked lack of consumer confidence and competition from family entertainment centers as their top concerns for 2018 (see chart, p. 77). This is a dramatic shift from the concerns for the 2017 season, when finding and managing a qualified staff ranked number one for both segments of the industry. That concern has fallen to the bottom of the pile.
These concerns likely stem from the flattening growth in visitation numbers. As more and different types of recreation businesses adopt adventure and experiential elements, the novelty of an adventure park or traditional program gets diluted. That makes the present time an important moment for operators to identify and market their unique value proposition.
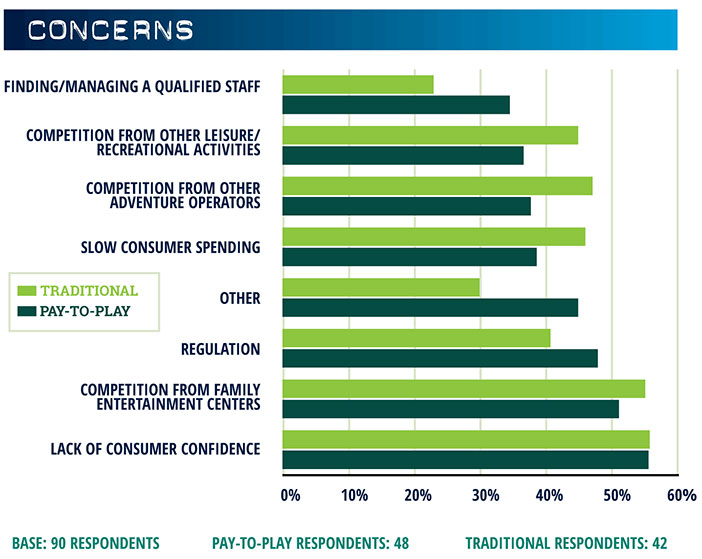
Another concern is regulation. This is especially true for traditional operations, which worry that the growth of commercial parks will lead to more stringent regulations on all aerial-based experiences, not just commercial ones. But regulations are now a bigger concern for P2P operators as well, perhaps because of increased attention from regulators and greater awareness of issues such as emergency braking.
The shifting lists of concerns provide yet another gauge of the fast pace of change in the industry. For many operators, simply doing the same thing could lead to diminishing returns, due to increased competition or more tight-fisted consumers, or both. Increased scrutiny of operations may also force changes to procedures or equipment. In a fast evolving industry, if you stand still, someone else is probably gaining on you—or flying past.
THE COMPLETE REPORT
This preliminary report is just a snapshot of the data collected in the Adventure Park Insider State of the Industry survey. We will present more complete data and analysis in a workshop at the Association for Challenge Course Technology annual conference and trade show in Fort Worth, Texas this coming February. Additionally, we will publish a full 2018 State of the Industry Report, which will be available sometime in late winter. Stay tuned.


