

The Data
A 2015 study from the American Journal of Emergency Medicine is a commonly-cited source for zip line injury statistics. However, the study failed to differentiate professional and amateur operations, and failed to account for the explosive growth of the aerial adventure industry worldwide. Instead, it simply sounded the alarm over a ten-fold increase in zip line injuries over a 20-year period. The study did report, however, that a large number of the injuries were from backyard operations, not pay-to-play or traditional operations.
In an effort to provide a broad look at injury and incident data for commercial operations, the 2018 State of the Industry Report asked operators to identify the most common causes and types of injury they see. Respondents indicated that the most common cause of injury was a slip or fall or “other” type of injury, which included heat injuries and insect bites. Scrapes, minor lacerations, and bruises were the most common types of injury reported.
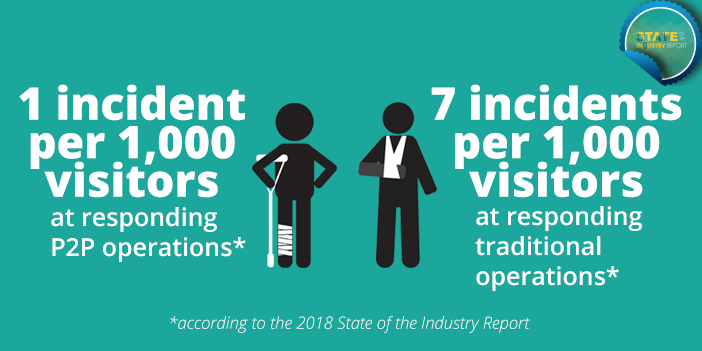
For respondents reporting both number of incidents and overall visitation numbers, the report extrapolates that there is approximately one incident per thousand at P2P operations, and approximately seven incidents per thousand visitors at traditional operations. What explains this disparity? Our assumption, based on open-ended comments, is that camps–with large volumes of minor participants–reported incidents from across the entire facility, not specifically aerial activities.
Are You Tracking Incidents?
All operators are encouraged to track injuries and incidents, including near misses, at their facility. This enables operators to identify potential trends and, using that information, take steps to mitigate as much risk as possible.


