


The term “big data” is often referenced in business today. But you don’t have to be a large, corporate organization for your business to benefit from using data.
Paul Cummings with Strategic Adventures recently posted this story about break even. If you haven’t seen it, it’s definitely worth a read. To paraphrase, he says that break even is a critical metric to track how your business is doing. He says that, in our industry, this number is typically measured in total participants (to over-simplify). The more people that visit, the closer you are to breaking even, and/or increasing profits.
Following this simple logic, growing the number of total participants is, of course, where the magic happens. Different sales and marketing tactics can be implemented to help move the needle, but acting on intelligence you gather can be just as impactful. Using data and studying trends in your daily and seasonal operations, including attendance and guest behavior, can play a significant role in making tweaks—both large and small—to your business that could increase total guests, and profits.
The sheer volume of information tracked, captured, and available can be overwhelming. In this two-part series, we’ll look at four operational data points that have the ability to guide you to making changes that increase your participants and revenue.
The first two we’ll tackle here are the park’s ramp pace, or the time it takes to get to capacity on peak days, and attendance trends.
Ramp Pace: How Quickly You Get to Capacity
This data point is focused on those busy days in your park that are selling out or getting close to sell-out. Those wonderful scenarios where you’re actually worried about the possibility of having too much demand, and are forced to turn people away due to supply constraints (i.e. staffing restrictions, harnesses, and overall capacity).
Many parks we work with are taking a more detailed look at their operations on peak days and making some changes to be able to handle even more paying customers. Here’s how:
The graph above is probably what your park attendance looks like on a peak day, assuming the crowd control flows—or number of people allowed to book in a given start time cadence—are static throughout the entire day (i.e. 10 people every 20 minutes).
You can see that it takes almost two hours to get to capacity in this scenario. Now consider this: you can release tickets at a faster rate during the a.m. ramp and p.m. drop-off periods in order to reach capacity sooner, and keep the park full longer.
The crowd-control flows are usually set with peak times in mind. During peak, bottlenecks are created if the pace isn’t tightly controlled. The staff’s ability to multi-task between check-ins, orientations, and harnessing a large volume of people at once dictates the flows.
During the morning or afternoon, when the park is not yet (or no longer) “full,” certain staff members may have downtime and can help in areas they otherwise wouldn’t be able to when the park is full (i.e. checking people in, helping with orientation, etc.). The park can be more efficient and safely handle more people per segment.
To accomplish this, you can create unique, customized segments based on your attendance trends. There are parks we work with that will expand their cadence in morning and afternoon segments from 10 people every 20 minutes to 30 people every 20 minutes.
Even if you are uncomfortable with such an extreme change, here’s what a very small change does to the flow of guests and ramp times:
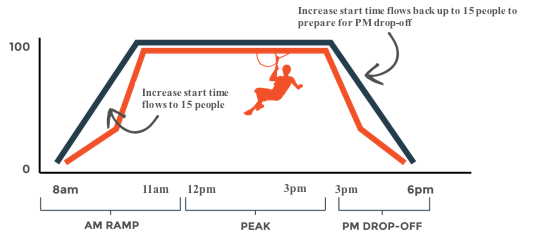
If making these small shifts sounds like more effort than it’s worth, consider this: if a park with a start cadence of 10 people every 20 minutes adds five people to each start time during ramp up (from 8 a.m. to 10:40 a.m.) and drop-off (from 3 p.m. to 5:40 p.m.) on a peak day, it could add another 90 paying customers per day. If an average ticket price is $50, that’s nearly $4,500 more per day. Even if this park has just eight sold-out days a season, that’s an extra $36,000 annually.
This is assuming demand on peak days is such that people will book the earlier and later times of day, allowing you to add more tickets during the morning ramp and afternoon drop off. To supplement this, it may be necessary to focus your marketing efforts on promoting need periods, and perhaps take the next step of implementing dynamic pricing strategies, which we’ll cover in a later article.
Daily Attendance Trends
Use data collected through your reservations system to identify trends in your park’s attendance patterns. Days of the week and hours of the day are both key trends to isolate.
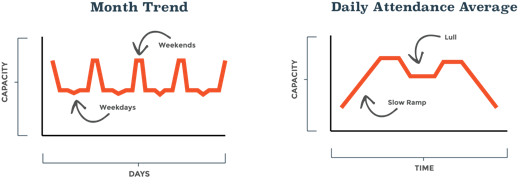 Identifying common times of day and days of the week that your park is below peak capacity will help inform changes aimed at growing your park’s attendance. Conversely, it will identify peak demand periods so you can plan accordingly and maximize your revenue potential.
Let’s look at some examples:
The Adventure Park at Virginia Beach Aquarium
The operators recognized the trend of weeknights being significantly slower than the busy weekend nights. Their solution was to start a “glow in the park” event during the week, and apply a smart strategy to their plan.
Objective 1: Create a fun, fast-paced environment with dynamic change and excitement.
- Distribute glow lights and have a DJ or band playing music.
- Two-hour climb times bring higher margins and more turnover to keep energy up.
Objective 2: Maximize typical tourist travel schedule.
- Management analyzed tourist patterns and identified Tuesdays and Thursdays as the nights to catch visitors on their way into or out of town.
Objective 3: Promote.
- Flyers at local businesses.
- Facebook events.
- Weekly newsletters to hotel contacts and previous visitors.
- Promote at local events.
The result? The park went from lulls on all weeknights to being nearly sold out two nights a week throughout the busy summer tourist season.
Treeumph!
Treeumph! recognized a very different kind of data point and acted on it: demand.
On select days, demand was high and the park was selling out. In some cases it was predictable (the Christmas holidays every year, for example). But it also happened at different times that were a surprise. By watching projections closely, the company could predict when sell-out was approaching and do something to capture that extra demand.
To accomplish this, Treeumph! used a two-pronged strategy.
- Extended Hours. On days that regularly sell out, the company schedules extended operating hours to accommodate demand. In addition, if weekly/daily projections show a day is approaching sell-out, hours are extended on the fly.
- More People. Overall, Treeumph! added a few people to each start time to maximize paying customers, but not so many that it impacted park safety or the guest experience.
Treeumph! now has more paying customers in the extended hours that would otherwise have been turned away.
The famous quote, “There’s no one giant step that does it, it’s a lot of little steps” rings true here. Using data and trends to identify times that you can consistently add guests can have a major impact on your bottom line without negatively impacting the flow of your operation.
Next up: in Part II of this series, we’ll look at how figuring out your average ticket price and average climb times can contribute to moving the profitability line.


