


In part one of this series, we discussed 10 business metrics that are important to track in your bid to dominate the world of adventure recreation—or simply make sound decisions and operate a successful business.
Metrics are only valuable if they are accurate, though. Here, we’ll examine some of the necessary steps that you must take to ensure that the metrics you are looking at are accurate and valid. By focusing on getting it right the first time, you’ll save yourself plenty of grief—and therapy—in the long run.
SETTING UP YOUR BOOKS
If you are just starting your business, you’re in the best position to start tracking your metrics. The process begins with setting up an accounting system, which is tracked with software such as QuickBooks or Xero. When setting up the system, it’s important to make sure you have enough detail in your chart of accounts.
So what the heck is a chart of accounts, anyway?
The chart of accounts is how your accounting system tracks your income and expenses, determining how each of those items is categorized. For example, let’s say you are starting an aerial park, and you plan on having two tiers of ticket pricing, as well as season passes, concession sales, and retail items for sale. Example 1, below, represents a hypothetical chart of accounts, on the income side, that is poorly set up:
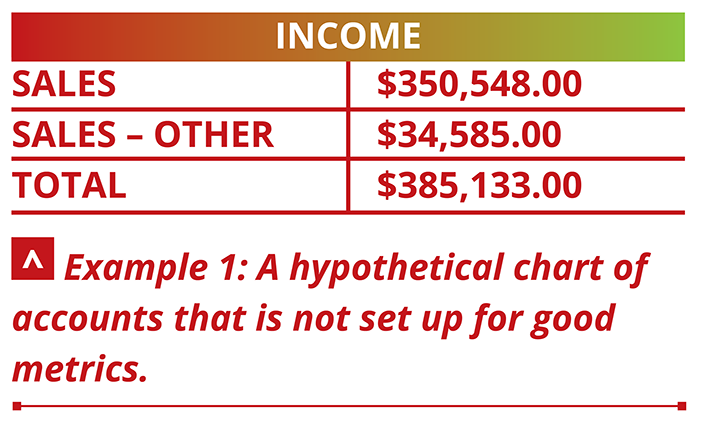
Example 2 represents a system that provides you with enough detail to get some useable metrics:
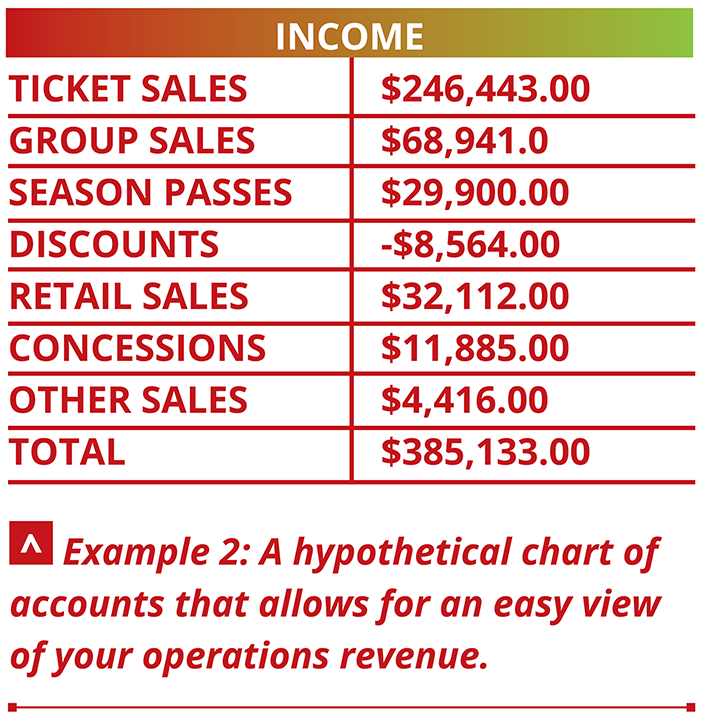
See the difference? With the chart of accounts in Example 2, we can easily see the breakdown of how you’re making money. Example 1 does not include enough detail, and requires you to dig deeper into your numbers.
That is, if you’ve even been tracking your numbers at all. Otherwise, it’s anyone’s guess.
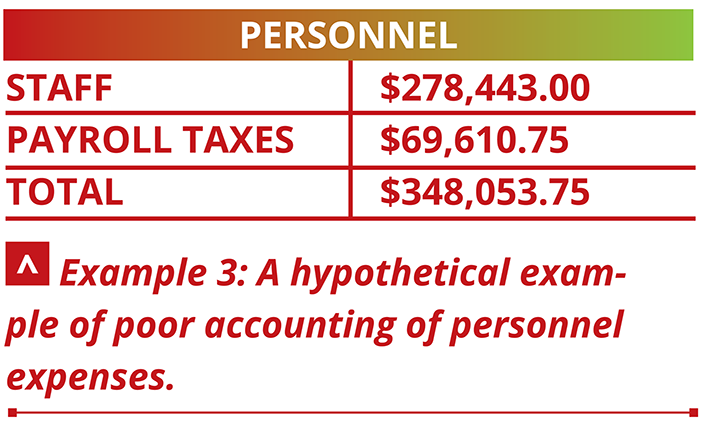
Example 3 represents a bad chart of accounts on the personnel side:
Example 4 is a better chart of accounts on the personnel side:
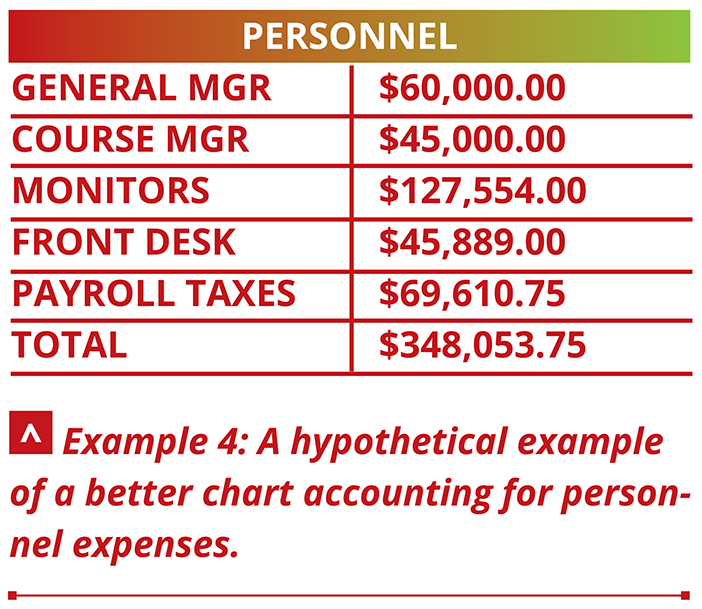
Again, with this level of detail, we can calculate metrics such as average park monitor cost per visitor, and average concession sales per visitor.
START WITH “CLEAN” NUMBERS
No matter how long you’ve been in business, it’s never too late to start tracking your metrics, but you’ll want to follow these steps closely.
First, make sure your financials are up-to-date and have been reconciled by your accountant. Having bad data, or incomplete data, can be even more dangerous than having no data at all. You may have heard the phrase “garbage in, garbage out,” made famous by computer programmers. It means exactly what it sounds like: if incorrect data is input, only incorrect data will be output. So if your data isn’t clean, your metrics are going to be off, and that can lead you to make some bad decisions.
Here is a common mistake that can be caused by inaccurate data: If you think that your average cost per participant is $25, when each visitor actually costs you $35, you may end up putting tickets on sale below cost. As a result, every guest you have coming in is costing you money. Yes, we’ve seen this happen, and the result is not pretty.
COMPARE APPLES TO APPLES
We often see clients comparing their own metrics to those of other competitors in the industry. While this may seem logical on the surface, it can actually be problematic if you’re not careful—and the danger is twofold.
For one, this practice assumes that those comparable businesses are using the same formula to get their results. If the formula is different at all, the numbers could be off by a significant factor. And second, there is no way to know that their data is even correct—and we’ve seen plenty of incorrect data. If everyone operated using the same accounting system and methods, then this would be easy to determine. But realistically, that’s not how it works.
Additionally, some metrics will change depending on variables such as market demographics and economic conditions. If you’re in the Midwestern U.S. and are comparing your average ticket price to those in Hawaii, you’re going to be perpetually disappointed. Even factors such as regional markets versus tourist demographics can provide data that is drastically different.
Instead, start with your own baseline metrics and track how they change over time. After all, you can’t influence other businesses, but you can certainly influence your own. Comparing yourself to others too much can cause disappointment, complacency, or both.
CORRELATION VS. CAUSATION
Data can provide you with all kinds of information, and it gets mighty tempting to think that all of this newfound knowledge explains everything that has ever happened in the history of your business. And often, it does. But just because two sets of data seem to be tied together, it doesn’t necessarily mean that they are. Here is an extreme example involving murder and ice cream:
 When ice cream sales go up, so do the rates of violent crime and murder. Now, of course, this doesn’t mean that ice cream makes people want to kill one another—unless some unsuspecting husband forgets to buy his wife her favorite pistachio gelato. The two are affected, however, by some of the same external factors, such as the increase in outdoor temperature. When the temps go up, people tend to get hungry and angry—some simultaneously.
When you are examining your metrics and trying to associate links between them, be sure to ask yourself if what you are seeing is causation (a linked result) or just a correlation (no direct connection). If you want to see more examples of correlation versus causation, check out www.howstuffworks.com. Or, if you’re a data nerd like me, pick up a copy of Spurious Correlations by Tyler Vigen.
DON’T MAKE RASH DECISIONS
Data informs decisions, it doesn’t make decisions for you. This is especially important when you’re working with metrics that involve staffing or marketing tools. Your employees are more than just numbers in an equation. The decisions you make affect their livelihood and can have a severe impact on employee morale. It’s better to take your time and really plan out any changes to management or staff. And if a change does occur, it’s important to be able to explain the logic and rationale behind any changes to your existing staff.
In marketing, specifically in determining return on investment, it can take a while for marketing to pay off. Running an ad or using new keywords on Google can take a few months to show traction. I would recommend a tactic known as A/B testing, where half of your target market is shown one version of an ad, and the other half is shown a slightly different version of the same ad. Once you see which one provides a higher return, you can run more of that one. Testing and measuring is the pathway to success in marketing. >>
YOUR METRICS DASHBOARD
Are you looking for a way to view all of your metrics in one place? Fear not, fellow metrics aficionados, Microsoft Excel and Google Sheets are here to save the day. You can do some really cool stuff with spreadsheets, so I recommend learning how to use them to serve your purposes.
Imagine having a page that puts all of this data into easy-to-read graphs with historical comparisons. With one glance—and a few clicks—you can know immediately if your performance is improving or slipping over time.
Again, clean data is the only good data, so be careful about how you are importing information.
YOU CAN DO IT
At the end of the day, all of your efforts are only going to matter if you keep track of accurate, relevant data that provides useful information. Now, this doesn’t require a PhD in statistics or five servers’ worth of client history, but by following the steps discussed here, you should be on the right path to tracking your company’s data in a way that works for you.
When all else fails, keep it simple—it’s better to track what you know than to make things too complicated, too quickly. By keeping track of your metrics—in a way that makes sense to you—you’ll be on your way to a solid, long-term business strategy. Or better yet, total world domination.

