
Facebook. Brochures. Clubhouse. Live rooms. Bus ads. Marketing has changed dramatically over the past decade, not only in who operators are trying to reach but in how operators are trying to reach them. Over the past six years, Adventure Park Insider has conducted the annual State of the Industry Report (SOTIR) and collected data from traditional and recreational aerial adventure operators on marketing spend, channel mix, and more.
As the mix of channels has grown and the messaging has gotten more complicated, we look at the trends of the past several years and then look ahead to what’s next.
WHAT ARE OPERATORS SPENDING?
Marketing spend took a hit during the pandemic, falling to an average of just 6% of total expenses in 2020, as compared to an average of 13% four years prior in 2016.
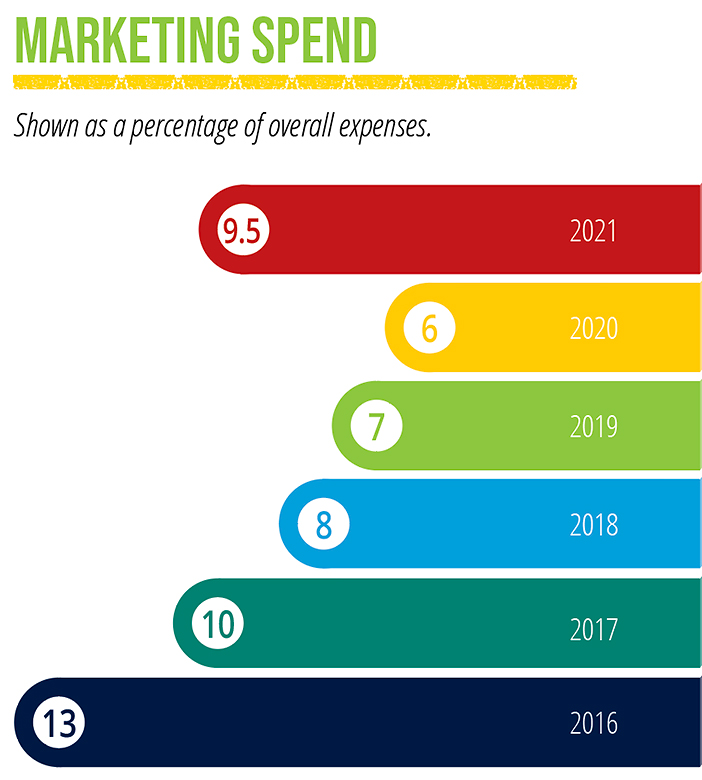
The U.S. Small Business Administration suggests spending about 8% of gross revenue on marketing if you make under $5 million annually and have an average profit margin of about 10-12%. This is a significantly higher number than 9.5% of expenses, the average marketing spend for operators in 2021. Other experts recommend targeting close to 10% of gross revenue.
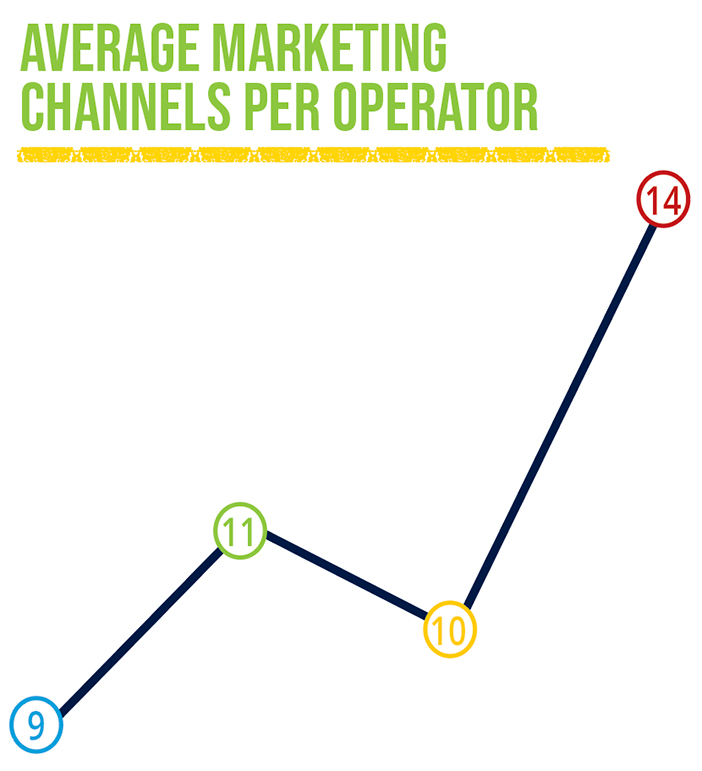
WHERE ARE OPERATORS MARKETING?
In 2021, respondents reported marketing across an average of 14 unique channels, up from an average of 10 in 2020. As the number of available outlets has increased in recent years, operators have expanded their channel use to reach a broader market.
Historically, there has been a reasonable mix of channels used between traditional media such as print advertising, local partnerships, or billboards, and digital media such as social platforms, digital ads, and search engine marketing. During the pandemic, both traditional and recreational operators skewed toward digital platforms for their ability to be nimble and react quickly to sudden changes brought on by the pandemic.
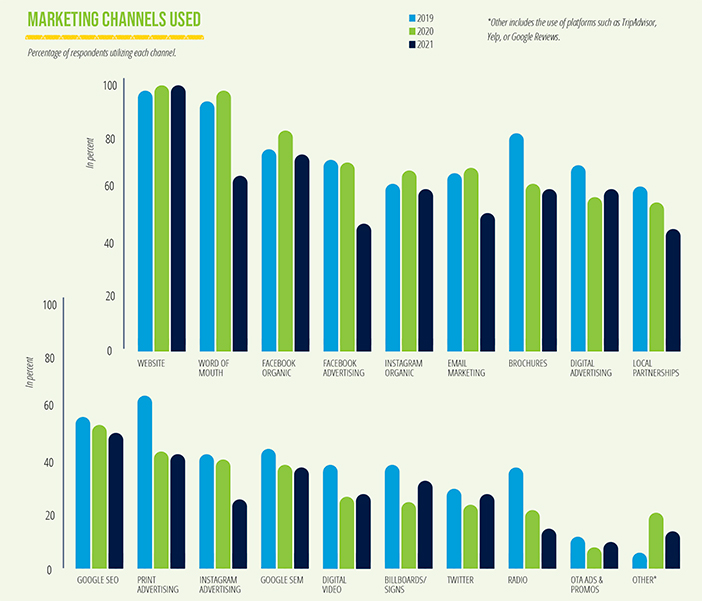
Traditional channel use did return in 2021, cutting through the digital noise that the pandemic amplified in most communication. Billboard usage increased as auto travel returned, allowing operators to reach drive-by traffic they might otherwise have missed.
Over the past several years, there has been an increased reliance on social platforms. However, many operators appear to be transitioning away from Meta, parent company of Facebook and Instagram, as a primary focus due to algorithmic changes that prioritize paid over organic posting. Operators still maintain an active presence on the platforms, but are encouraging traffic back to webpages.
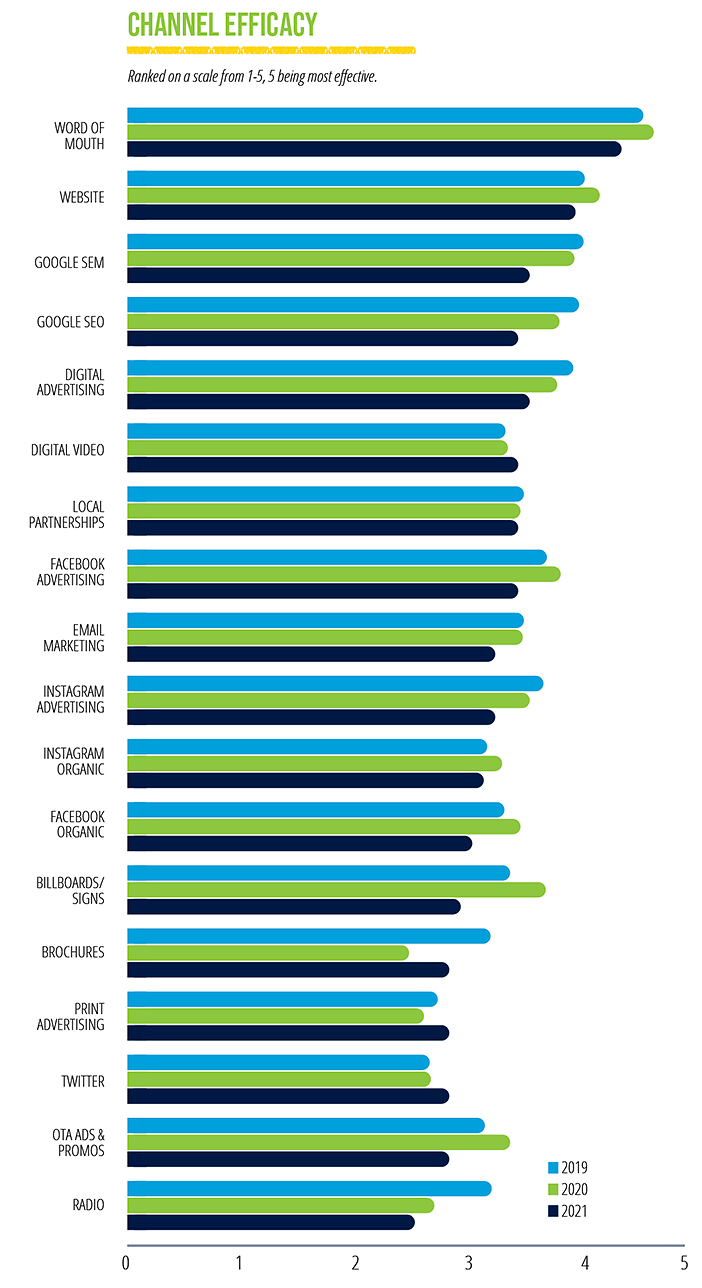
Where are operators spending online? Websites remain the top focus as a marketing channel, and with good reason. They have remained the most commonly-used and most efficacious channel according to respondents, second only to word of mouth. Additionally, while paid digital channel use has dropped slightly as operators shift back to traditional channels, in the years since the onset of the pandemic, operators have remained focused on digital channels.
The primary goal of paid digital channels is to drive traffic to websites and convert website visitors into paying guests. This is where proper implementation of SEO and SEM can really shine, as well as the creation of a strong website designed to convert customers. That is where measuring channel efficacy comes in handy.
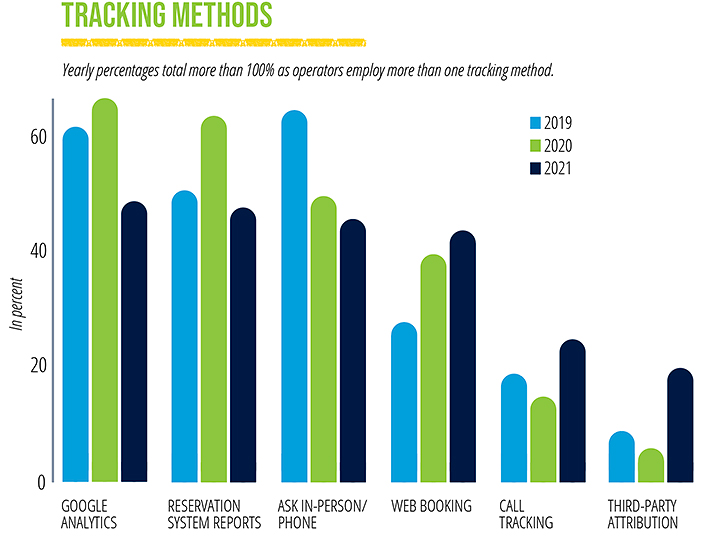
TRACKING
How did you find us? In this increasingly busy marketing landscape, operators are looking to identify just how consumers found them. Was it through that flashy display ad? A partnership with the restaurant down the road?
Over the past three years, the State of the Industry Survey asked respondents about the tracking methods (see chart, following page) they use to determine where their guests are coming from in order to measure the ROI of their marketing campaigns.
Tracking limitations. However, these methods of analytics are becoming increasingly limited with the advent of new data protection programs such as Apple’s Mail Privacy Protection (MPP), which impacts open rates on emails. >>
Customer acquisition cost. According to HubSpot’s 2022 State of Marketing Report, one of the key marketing metrics business owners fail to track is the cost of acquisition per new customer. A similar metric included in the SOTIR data is the marketing spend per visitor (marketing spend/paying visitors), which is important to track.
Why? Because the less it costs to get a customer through your door, the better.
To determine whether your marketing is improving, look at your operation’s per person spend over a multi-year period as compared to your visitation numbers over the same multi-year period.
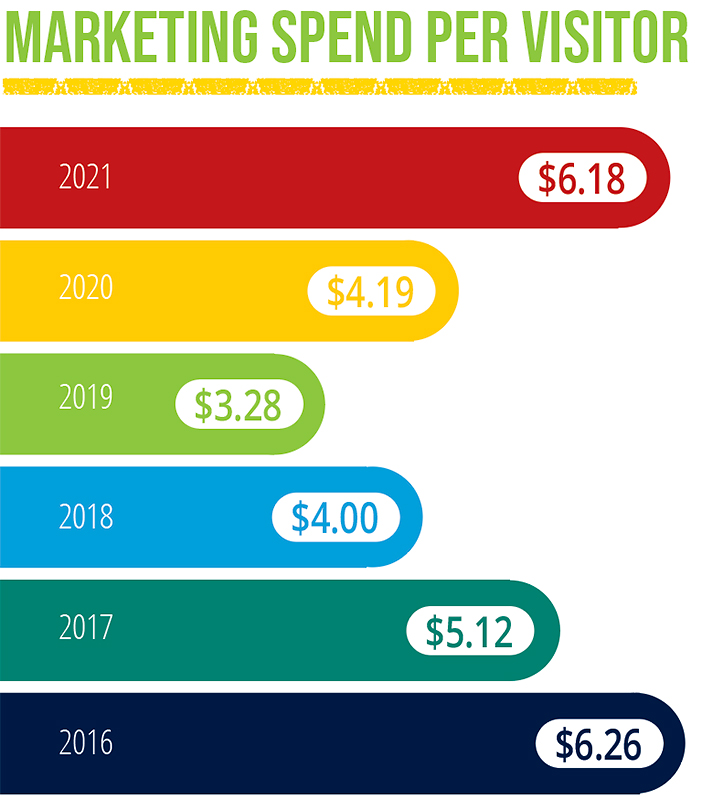
According to State of the Industry Report data, on average, the marketing spend per customer declined steadily from 2017 to 2019 to $3.28, a drop of more than 47 percent from 2016’s high of $6.26. However, that trend has since reversed, with marketing spend per customer jumping back up to $6.18 in 2021. Now that people are returning to normal activity and competition for time and consumer dollars is at an all-time high, operators will be tasked with finding ways to use marketing dollars efficiently and creatively.
Follow the yellow brick road. The customer pathway is a journey, not a direct flight. For example, in the world of digital ads, the intent is to drive traffic to your website where visitors then, hopefully, convert into paying customers. As measurement steps are implemented, it is also important to follow the customer pathway. If your digital ads are driving website traffic but those visitors aren’t converting into paid customers, then it might be time to take a look at your website functionality and design. Follow the path to see where potential customers might be falling off as you look to allocate marketing dollars.
SO, WHERE SHOULD YOU SPEND YOUR MONEY?
Streamline. This is where metrics like spend per customer and tracking come in handy. Which channels are actually producing a strong return on investment? Consider the monetary investment as well as the investment of time and effort it takes to produce and manage content and campaigns. For example, was the engagement that TikTok video got worth taking guides away from tours? How do you know?
Start by measuring ROI and figuring out where the messaging can be streamlined. The trick is not to end up in some Blockbuster-esque marketing myopia where you just do the same thing for the next 10 years because it works. Have enough of a solid foundation where you have the resource flexibility to experiment and innovate as opportunities arise. Don’t spread your messaging so thin across every channel that you can’t test out the latest and greatest if your marketing team thinks it may be a hit with your audience.
Efficacy. Measuring marketing efficacy is, at minimum, an annual task because channel efficacy changes year-to-year. Billboards are a prime example. In 2019, they were lower in terms of efficacy, but when drive markets returned after the initial lockdown at the onset of the pandemic in 2020, billboards became quite effective. Once “revenge travel” by air ballooned, though, billboards dropped in 2021. Now, with air travel’s major hiccups and local travel growing again, billboards may once more be effective.
There are countless factors that dictate marketing efficacy, which is why it’s important to constantly reevaluate what’s working in your messaging pipeline.
Lean into being a unique experience. Zip lines, ropes courses, and team building are all unique experiences. If any takeaway came out of the pandemic, it’s that people want to get out and experience the outdoors and they want unique experiences. This is where you can lean into your unique value proposition, landscape, experience, thrill, and outcomes—and bring these elements to the forefront of your messaging.
Create personal connections. Take advantage of opportunities to create personal connections with customers by using customer data. Collect data on your customers, but in the right way. Many consumers have become increasingly savvy about digital marketing and who they give their data to. Operators may no longer be able to rely on large tech giants such as Meta to target the profiles of their ideal consumer.
So, how should you collect data on your customers? First and foremost, leverage your booking system to capture customer data you can use to follow up with, say, a post-trip email survey or text to check in on their experience. Both email surveys and automated text messages are lower-tech than data-mining cookies, but they are tools that can create a connection with customers—provided they are used correctly (read: don’t overuse and annoy).
Reach beyond the industry. In 2020, operators saw an increase in the diversity of their guests, and diving deeper into the data, saw that many of those guests came from zip codes that hadn’t been regular among previous guests. Operators anecdotally attributed this to word-of-mouth and said that people looking to get outside during the pandemic shared the experience with their neighbors. This is a ball we as an industry want to keep rolling, and we can look to some of the big players in the outdoors for ideas on how to do so.
For example, The North Face partnered with Spotify to release an exclusive song only available in rainy weather to launch its new rain shell. Collaborations like this help reach people who may not consider themselves “outdoorsy” and introduce them to new products. Operators can follow suit by creating local partnerships with other businesses like those in specific zip codes, or that may draw in “less outdoorsy” audiences to help invite targeted consumers to come experience the magic of the outdoors.
Remain diligent with your marketing, track your results, and you’ll reap the benefits.


