


2020 was a bummer in so many ways. Murder hornets, wildfires, not to mention a pandemic that impacted nearly every aspect of everyday life. However, there were some silver linings, especially for outdoor adventure operators, from heightened activity from newcomers to new models for doing business.
Despite local and state regulations that may have limited operating days and daily capacity, more than 80 percent of respondents to the fifth annual State of the Industry survey conducted by Adventure Park Insider in the fall of 2020 were able to open in some capacity. More recreational respondents (87 percent) were able to open as compared to traditional respondents (65 percent).
Many of those reported sold-out days.
More than 190 aerial adventure operations responded to this year’s survey, providing comprehensive business and operations data, which we aggregate and analyze to produce the annual State of the Industry Report. The data, along with other insightful resources, can help aerial adventure operators make informed decisions about every facet of their business.
COVID-19 IMPACTS
The impacts of the Covid-19 pandemic were far-reaching. Many operations were preparing to ramp up in early March in advance of school spring breaks, starting annual hiring cycles for the busy season, and kicking off staff training. Much of that ground to a halt throughout North America as the pandemic took hold and businesses were forced to shut down.
During this downtime, operators scrambled to determine what operations would need to look like when they were able to reopen. Many purchased additional PPE for both staff and guests, changed booking policies, and reimagined operational procedures. These last-minute additions increased bottom-line costs for the shortened season.
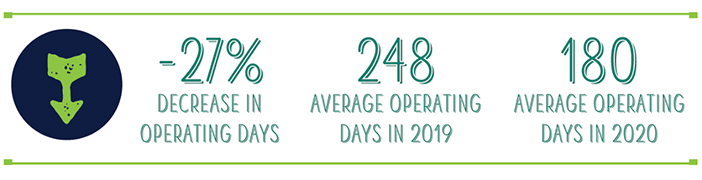
Shutdowns shortened the season. On average, respondents indicated they operated 180 days in 2020, 27 percent down from an average of 248 days in 2019. Year-round operations averaged 221 days, while seasonal operations averaged 133, down from 302 and 186, respectively, in 2019.
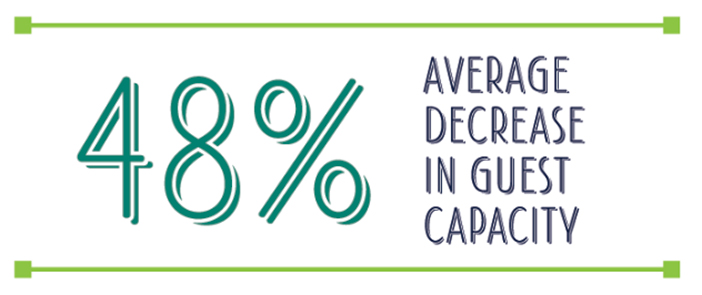
Reduced capacity. Reduced operating days were coupled with reduced capacity. On average, operations reduced capacity by 48 percent. Small operations, those with visitation of under 5,000, reduced by the largest percentage, 58 percent, while medium and large operations reduced by an average of 42 percent and 37 percent, respectively. This is likely due to the fact that many traditional operations, which had a harder time adjusting for Covid this season, tend to be smaller in terms of visitation. They also tend to have a smaller physical footprint compared to larger operations with higher visitation, creating less opportunities for social distancing.
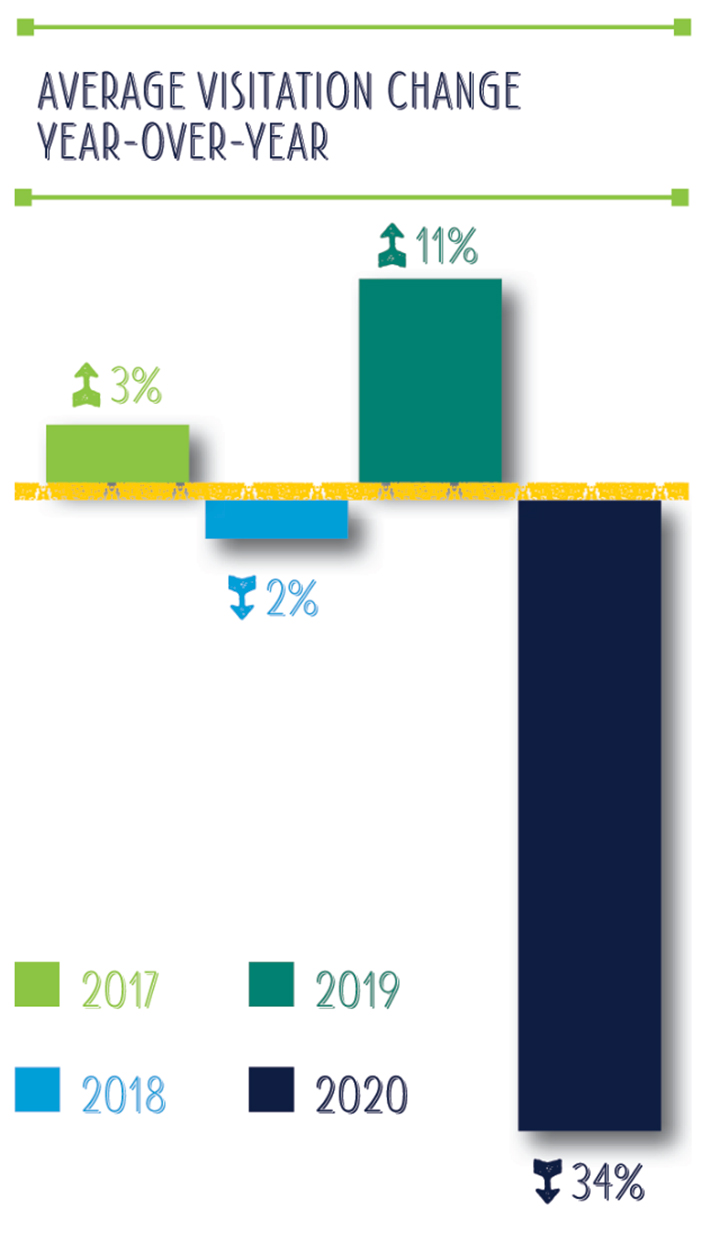
Reduced visitation. These two realities of 2020—reduced operating days and reduced capacities—unsurprisingly combined to equal reduced visitation throughout the season. On average, visitation was down 34 percent compared to 2019.
With the decrease in operating days and capacity, revenue also decreased, by an average of 24 percent—from an average of $794,207 in 2019 to $603,560 in 2020. The largest decrease was for small operations of less than 5,000 visitors, which saw an average decrease in revenue of nearly 70 percent.
SILVER LININGS
So, where is this silver lining?
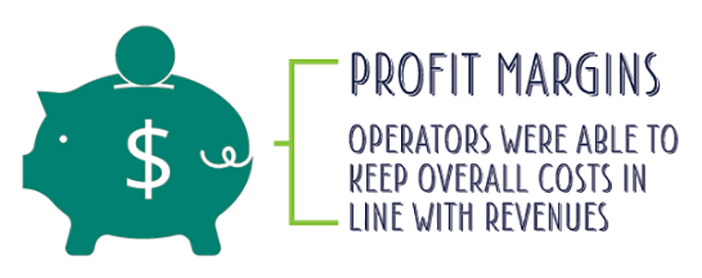
Profitability. Most importantly, operators were able to keep overall costs in line with revenues, and reported an average profit margin of 25 percent—in line with previous years, and far better than anyone could have hoped at the outset of the pandemic.
Distribution of visits. One key to this success: Despite the restrictions put on operators in 2020, respondents averaged 41 visitors per day, only four less visitors per day as compared to 2019. This was a significant accomplishment.
This suggests operators were able to reduce demand at “peak” times and spread visits across the week. While the remote work environment and virtual schooling taking place in 2020 enabled an increase in midweek visits, these trends are likely to continue to some extent into 2021, and operators will have an opportunity to create ways to continue capitalizing on this trend.
Capacity management. Anecdotally, some operators who reduced capacities are indicating that they will keep lower capacities in place in 2021 to improve the overall guest experience. Considering the relatively small reduction in average daily traffic, this decision will likely either maintain, or improve, the bottom line as operators streamline costs.
Diversity. Anecdotally, too, respondents reported an increase in the diversity of their guests— racially, socio-economically, age, as well as an increase in guests from more urban locations venturing outside of city limits to get outdoors and try new experiences. Several respondents reported seeing a surge in visitation from markets that may not have traditionally had the discretionary spending, but did following the first round of stimulus checks.
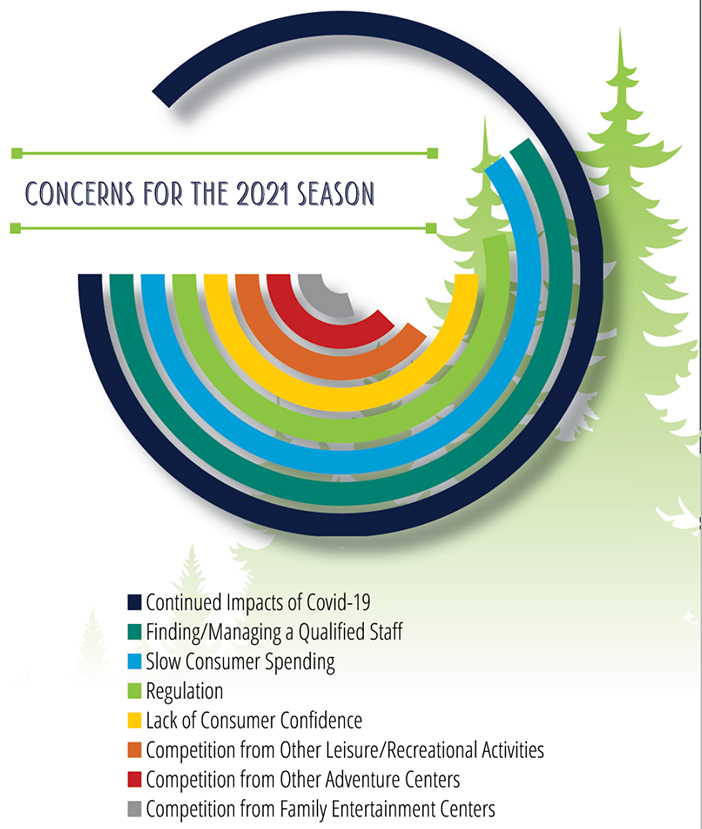
Concerns for 2021. As we look toward 2021, respondents are unsurprisingly most concerned about the continued impacts of Covid-19 on the upcoming season. While many hope that the new year eventually allows for a return to a somewhat normalized economy, it’s likely that many consumers will be feeling the impacts of 2020 for years to come. As a result, some operators report looking for lower-cost activities in order to entice those consumers who may have more moderate discretionary spending budgets.
Regardless of what 2021 brings, the aerial adventure industry has shown that it is capable of weathering the storm and operating in challenging conditions.
Wait! There’s More—Much More
This topline report is just a snapshot of the data available in the complete State of the Industry Report, which combines proprietary research, third-party data, and expert insight to take a comprehensive look at the marketplace and the broader activities landscape.
In the complete report, we take a deep dive into trends, revenues, visitation, and other important metrics for the various types of operations. We also a take a look at broader industry implications by segmenting the respondents into two general groups: recreational/recreationally focused businesses, and traditional programs.
Plus, Adventure Park Insider is presenting a more in-depth look at the survey results in a session during the virtual ACCT Conference.
To order the complete State of the Industry Report, go to: www.adventureparkinsider.com/state-of-the-industry=report.


