


The 3rd annual Adventure Park Insider State of the Industry Survey shows that aerial adventure operations and traditional programs saw relatively flat visitation over the past year, at least for respondents who reported both their 2017 and 2018 seasonal numbers and who operated for the full season both years. This lack of growth is likely due, in part, to the increasing number of zip tours and aerial parks, as this growth spreads visitors across a larger number of operations. A second factor is a greater number of operating days lost to weather and natural disasters in 2018. However, operators remain optimistic about future visitation, and are planning for continued growth in the industry overall.
Flat visitation does not mean the industry is any less dynamic than it has been. The number of parks continues to grow; 25 percent of reporting operators started business in the past four years. Further, established recreational/commercial operators are adopting elements of traditional/educational programs, and vice versa, leading to a blurring of the lines between the two branches of the industry. Those are some of the key revelations in this year’s survey.
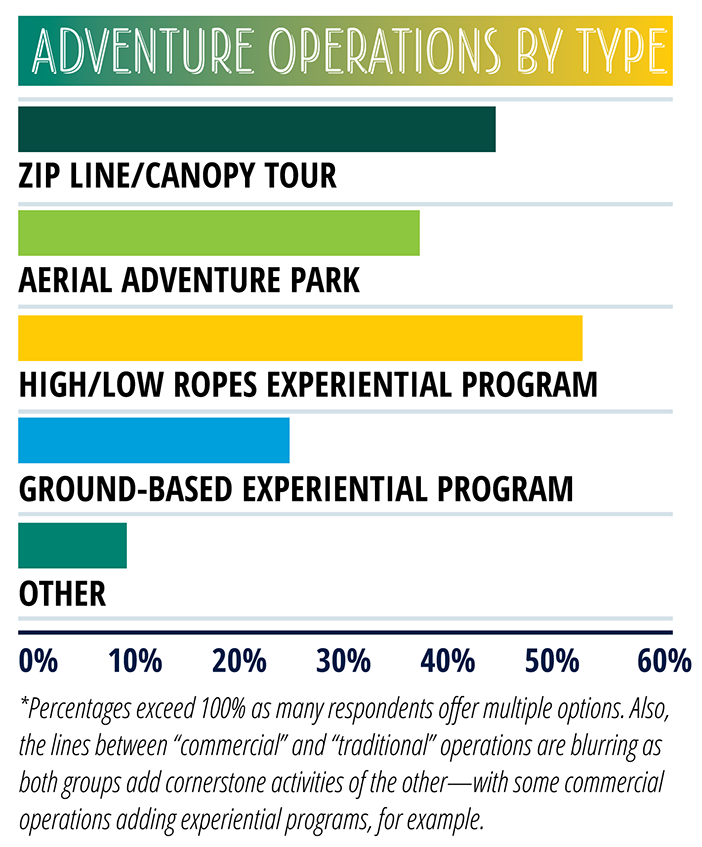
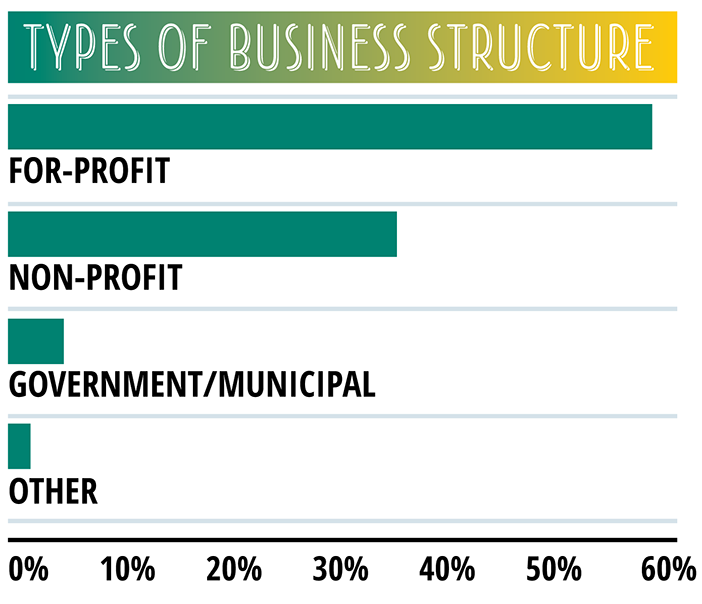
Previously, we have segmented respondents into two general groups: pay-to-play (P2P)—commercially and recreationally focused businesses, and traditional—programs that are developmental, therapeutic, or educationally-focused in nature. We have continued this segmentation here.
The larger, broader sample base makes year-over-year comparisons with past surveys more difficult, though we have made comparisons where possible in this preliminary report. We will deep dive the year-over-year comparisons within the various types of businesses in the final report in the Spring 2019 issue of Adventure Park Insider. That report will provide more in-depth analysis on recreational adventure operation segments as well as traditional camp, educational, and therapeutic programs, and additional data on marketing and staffing, including salaries.
VISITATION
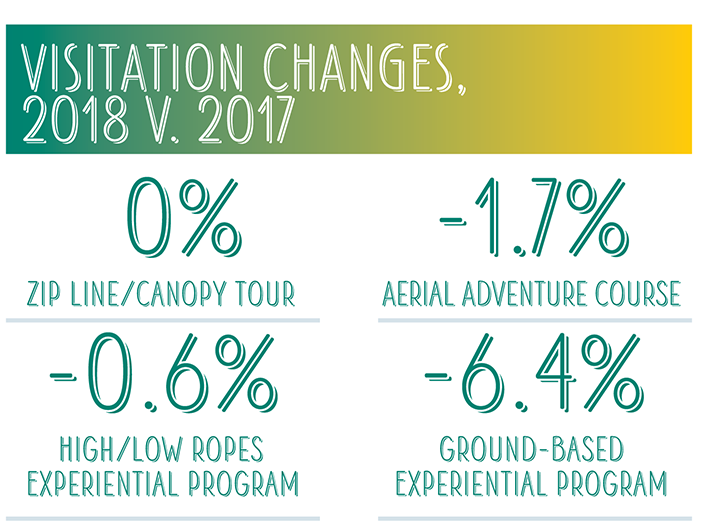
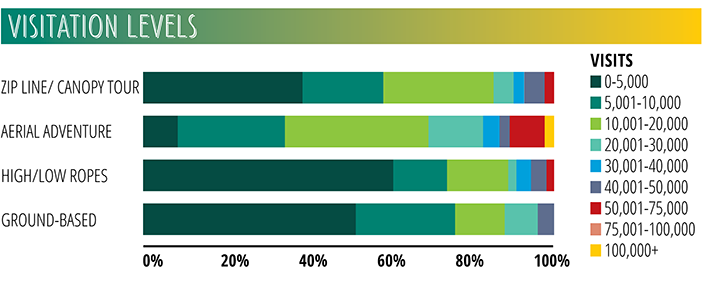
Visits flat. Overall, visitation in 2018 was flat compared to 2017, across all types of operations. Zip line/canopy tour operations averaged 12,564 visitors, while aerial adventure parks averaged 21,668. On the traditional side, high/low rope experiential programs reported an average of 8,914 visitors; ground-based experiential programs, an average of 8,883 visitors.
Respondents reported visitation numbers going back to 2014, allowing us to make direct comparisons of visitation volumes for operations reporting multiple years.
While the average change is essentially flat, some businesses that operated for full seasons in both 2017 and 2018 reported as much as a 30 percent decrease in visitation in 2018, while others reported increases of 25 percent or more.
Unplanned closures. In part, lack of growth stems from a decrease in operating days. In 2017, traditional operators had an average of 5.5 unscheduled closures, while P2P operators had an average of 7. Those numbers rose to 10 and 13, respectively, in 2018.
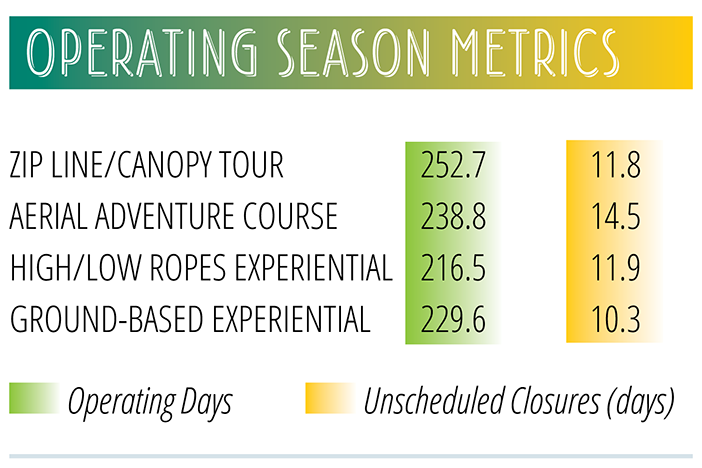
Reasons for unscheduled closures were mostly weather-related. Anecdotally, operators cited reasons as mundane as rain or as dramatic as hurricane damage or smoke from wildfires. Many indicated the early season was wet and cool in many parts of the country, which may have depressed visitation as well.
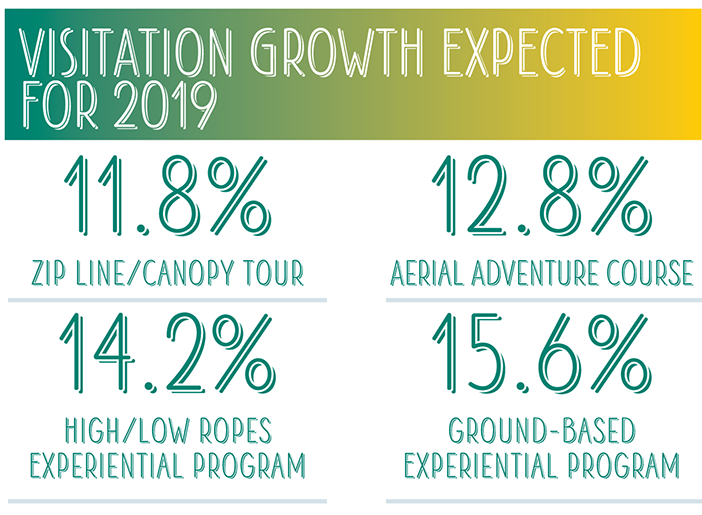
2019 growth. Operators predict growth in visits for the 2019 season, though the predicted rates are slightly lower than in years past. Perhaps operators are becoming more conservative in their budget estimates based on their experience in 2018. Interestingly, traditional programs anticipate the greatest growth—a reversal from the past few years.
FINANCIALS
Revenue averages. Traditional operators reported average revenue of $111.12 per visitor in 2018; pay-to-play operators recorded $97.55 per visitor. These numbers represent a decline from previous surveys, likely due to a higher percentage of smaller operations in this year’s respondents. (Ed. Note: We will compare like-sized operations and present additional data at the Association for Challenge Course Technology conference in Denver in our session, “How’s Business: An Industry Analysis,” and in our final report in the Spring 2019 issue.)
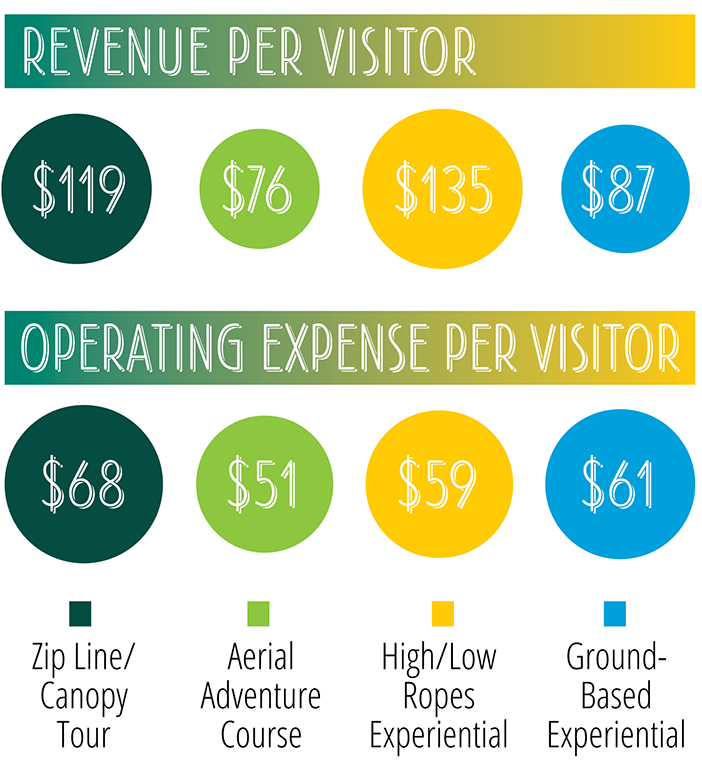
Margins rise. Despite the lean year for visitation, profit margins trended up. Commercial operations reporting both revenue and operating expenses for the 2018 season indicated an average profit margin of 25 percent. This is a 4-point increase over the 2017 season for those same operations. This increase may be due to a combination of increased operational efficiencies, higher prices, and the wider variety of activities offered by operators to increase “stickiness.”
ACTIVITIES & AMENITIES
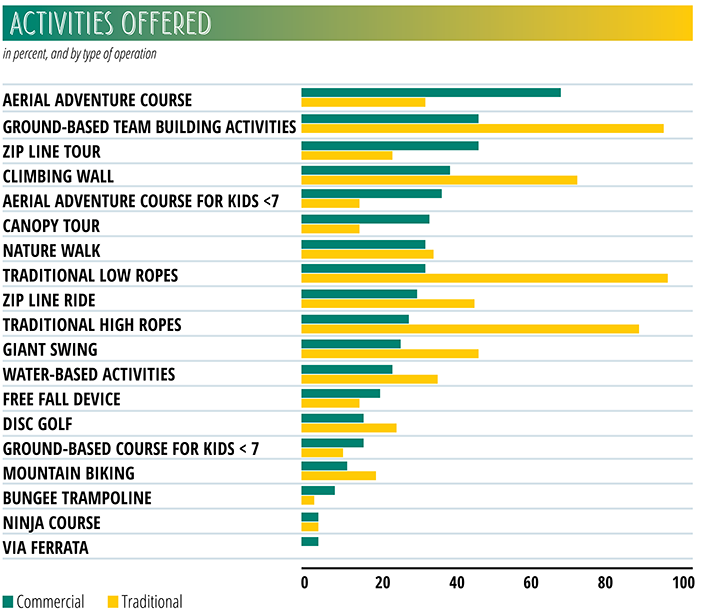
More activities. Operators continue to expand the variety of activities offered at their operations. Some of the most popular activities, outside of those cornerstone activities such as aerial adventure courses or traditional low ropes, are giant swings and climbing walls.
Blurring of the lines. The activities offered by the various segments of the industry highlight the blurring of the distinction between traditional and commercial operators. Operations that formerly offered only traditional activities designed for therapeutic, developmental, or educational purposes are increasingly adding what would be considered more commercial activities, such as zip lines and aerial adventure courses. Conversely, recreational operators are adding ground- and aerial-based team-building and team-bonding programs. To quantify this: 45 percent of commercial respondents offered team-building or -bonding in 2018, compared to 33 percent in 2017.
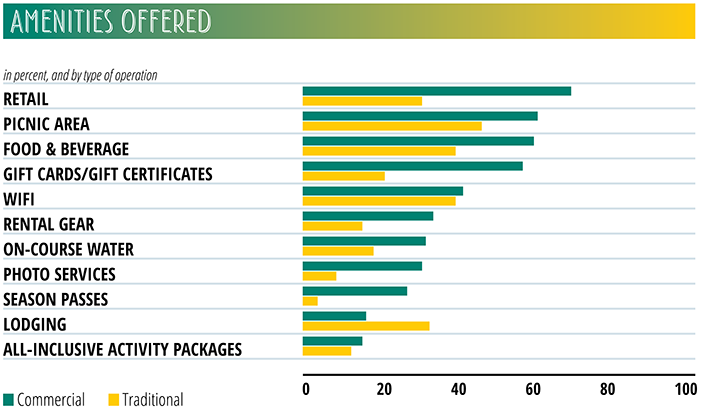
More amenities. Both P2P and traditional operations are offering more amenities to participants. One key example: A majority of commercial operators, 59 percent, offer gift cards and gift certificates. These are an opportune way to capitalize on the “bucket list” market and word-of-mouth marketing.
Future plans. Operators plan to add an even wider mix of both activities and amenities to their operations. As of November 2018, 52 percent of respondents were planning capital expenditures for the 2019 season, and another 27 percent were considering them. The most frequently planned additions include photo services, giant swings, aerial adventure courses, and ground-based courses for kids under 7. On the traditional side, operators are planning to expand their menu of high and low rope elements as well as add aerial adventure courses and climbing walls. All types of operators are considering a variety of activities and amenities, such as disc golf, that are relatively inexpensive to install and operate.
INJURIES & INCIDENTS
Injuries thankfully remain a relatively uncommon occurrence. Operators who track injuries reported an average of 5.9 injuries during the 2018 season. That equates to an injury rate of 1.29 injuries per 1,000 visitors for those operators who reported the total numbers of both injuries and visitors for 2018.
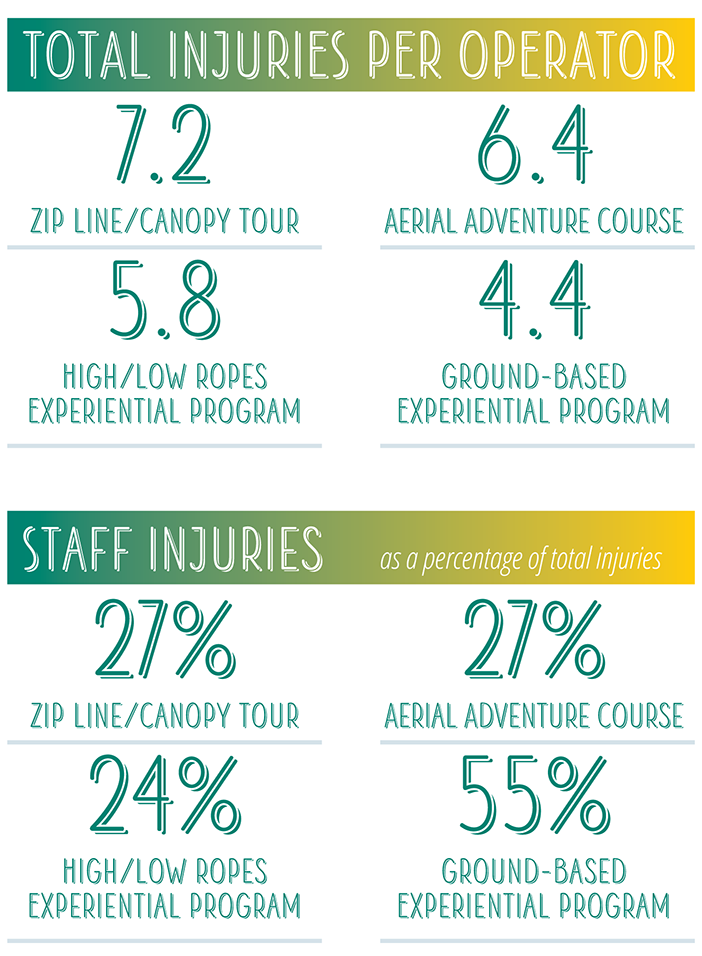
Staff injuries comprised an average of 34 percent of all injuries seen in 2018. Ground-based experiential programs reported the highest percentage of staff injuries, at 55 percent of all injuries, an average of 2.4 staff injuries per operator.
CONCERNS
Staffing woes. Finding and managing a qualified staff remains the number one concern. While business expansion has increasingly allowed for more opportunity for staff to progress into supervisory and managerial roles, operators are increasingly struggling to find qualified entry-level staff. This issue is not unique to the aerial adventure industry; other recreation industries, such as the amusement park and ski industries, face similar issues as they compete with year-round operations and larger organizations that are able to offer a wider variety of benefits.
Oversight. Regulation has, unsurprisingly, crept up the list of concerns going into 2019. The uncertainty around the proposed changes to ASTM F2959-16, which could end the exclusion for camp, educational, therapeutic, and other non-commercial operations and bring them into the scope of the standard, is the most concrete source of this concern. But ongoing state efforts to increase regulation are contributing to this concern as well. The blurring of the lines between commercial/recreational businesses and traditional/educational programs is likely another factor.
Consumer spending slowing? With the relatively stagnant year for visitation, it’s unsurprising that operators are increasingly concerned about slow consumer spending. While weather likely contributed to keeping visits flat in 2018, it’s also possible that the decade-long economic expansion is running out of steam. Some leisure time studies in the past have shown a drop in recreational activity preceding the onset of a recession. Operators should be on the lookout for signs of consumer fatigue.
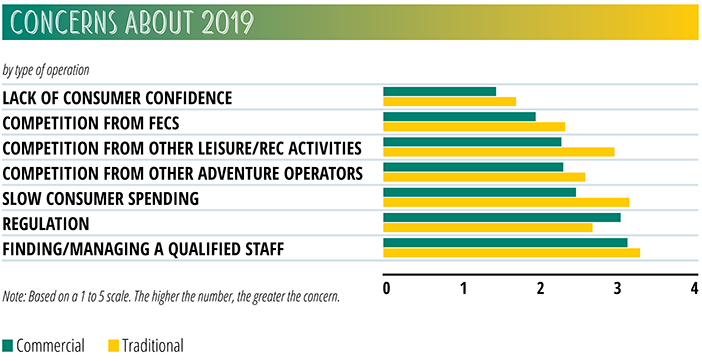
Other factors identified by operators that could contribute to slower consumer spending are political and economic instability, as well as climate change (which some experts say has contributed to the increase in hurricanes and wildfires).
FULL REPORT
The information reported here is just a preliminary look at the data collected in the 3rd Annual State of the Industry Survey. We will present a more complete analysis in a workshop, “How’s Business: An Industry Analysis,” at the 2019 Association for Challenge Course Technology International Conference and Expo in Denver, Colo. The full 2019 State of the Industry Report will appear as part of the Spring 2019 issue of Adventure Park Insider. The full report will include a deeper dive into the data discussed here and delve into marketing, employees, and salaries, with more extensive year-over-year comparisons for a variety of data points. Stay tuned.
Acknowledgements
Several groups contributed to the refinements made to this year’s survey. They include:
ACCT RESEARCH COMMITTEE
Lizzie Lange, Assistant Professor & Program Director for Exercise & Sport Science, William Peace University, NC
Mark Wagstaff, Ed.D., Professor of Recreation, Parks, and Tourism, Radford University
Jose H. Gonzalez, Ed.D., Assistant Professor Recreation and Tourism Management, California State University–Northridge
Chris Howard, Canoe Kentucky
Jolee Jones, MS, Director, Stone Canyon Outdoor EdVentures
GUEST RESEARCH
Scott Hannah, President
Jeni Batte, Vice President, Account Services
ADVENTURE PARK INSIDER EDIT SQUAD
Paul Cummings, Strategic Adventures
Bahman Azarm, Outdoor Ventures
Sara Bell, The Gorge
Keith Jacobs, Experiential Systems
Lori Pingle, Adventure Development Team
Jamie Barrow, Vail Resorts


