


TRACKING CLAIMS OVER TIME
A note regarding the data in this article: Most of the time, claims are not reported on the date they occur. Depending on the state, due to the statute of limitations, some claims can be reported from one to seven years after the fact. This means that the number of claims reported for 2020 will continue to rise over the next several years.
Since claims data take time to “develop,” 2019 offers the most recent year for which data have statistical value. The data in this report reflect claims filed through late 2020 for incidents that occurred in 2019 or earlier. (Data provided by Granite Insurance.)
In the past, the aerial adventure industry has often based its perception of safety on gut feeling. That leads to comments like, “We haven’t seen any big stories in the news this summer—it’s good to see the industry becoming safer.” Is that assumption accurate, though? Perhaps the stories just aren’t making the front page.
Risk management advice and safety programs, recommendations, and education are best based on data, not assumption or instinct. An understanding of current incident data, as reflected in incident claims history, arms the industry to run safer, better informed operations.
SAFETY IN THE AIR
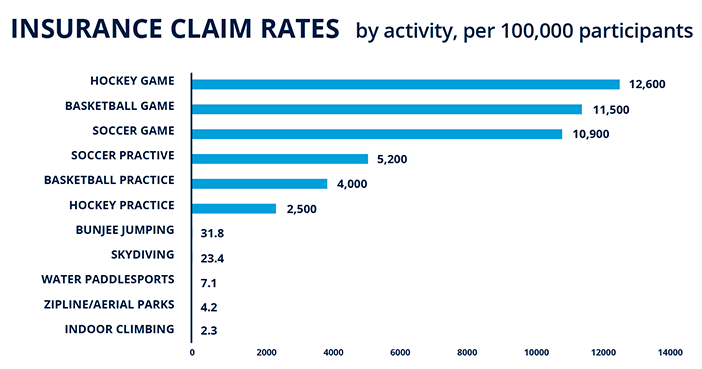
Data published by Granite Insurance and other associations and research groups show that zip lines and aerial parks are safer, measured by insurance claims per 100,000 participants, than many of the more common sports that people, and especially kids, participate in.
Next time a retailer refuses to resell your tickets, or a school group refuses to let their students come for a teambuilding event due to safety concerns, feel free to share this statistic: a person is 1,000+ times more likely to get injured in a soccer game than at an aerial adventure park (see Insurance Claim Rates chart on opposite page).
UNDERSTANDING CLAIMS PER 100,000
Claims per 100,000 participants is the best indicator we have for answering the question, “is the industry becoming safer?”
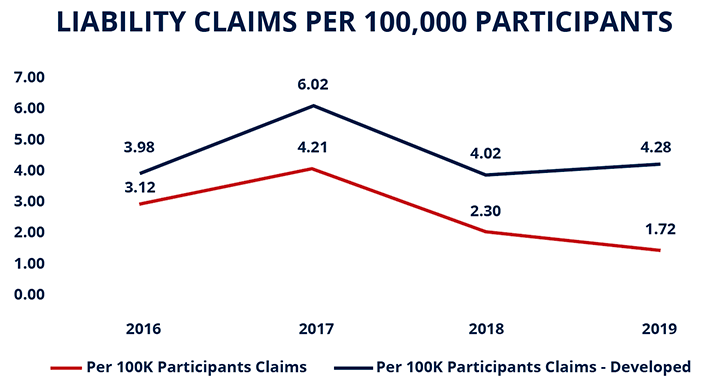
The current prediction is that 2019 incidents that result in an insurance claim will eventually hit 4.28 per 100,000, even though the claims rate is currently 1.72; more claims will be filed closer to the statutory time limit. For the period from 2016 to 2019 (see Liability Claims Per 100,000 Participants chart, at right), we see that liability claims were relatively low compared to many other sports.
Cautionary note. It is important to pay attention to spikes in the data, though. For example, in 2017 the number of incidents per 100,000 rose to 6, up from 4 in 2016. Why?
Analysis suggests this spike was tied to the introduction of mechanical brakes. Overall, mechanical brakes have been good for the industry. However, operators experienced a significant learning curve while adopting the brakes. The 2017 spike reflects that lack of familiarity with the tool. As time has passed and operators and guides have become accustomed to mechanical brake usage, incidents have declined accordingly.
A key takeaway here is that anytime you change your operation in a large way, there is a learning curve. To shorten the learning curve, be extra cautious and invest in training.
SAFETY SAVES: THE COST OF CLAIMS
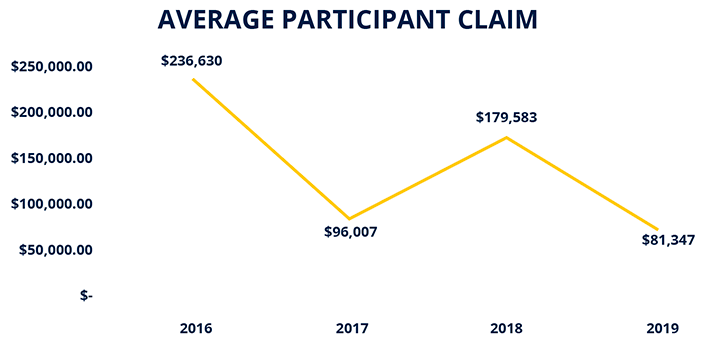
Data illustrating the changes in average participant claim costs can help operators adopt best practices.
We are fortunate in this industry that individual operators do not have to deal with liability claims too often. However, when a claim does happen, it can be costly. The average cost of a claim in 2019 was $81,437 (see the Average Participant Claim chart, below). That is actually an improvement from prior years. Back in 2016, the average cost was $236,630.
What is leading to lower per claim costs?
1. Operators are reporting their incidents much quicker. In 2014, the average time to report an incident was 184 days after the incident. In 2019, the average was 26 days. The earlier an operator involves the experts (the insurance company) in an incident, the more time the experts have to take action, and the more control they have over how the claim develops.
2. Claims are settled faster due to quicker claims reporting. In 2014, the average claim took 454 days after the incident to close. In 2019, the average claim closed in 79 days. That means less expense for insurance and legal staff.
3. Defense attorneys have deepened their knowledge. As defense attorneys learn the ACCT standards and the inherent risks of industry activities, they become more skilled in defending industry claims. As a result, the average amount of money spent on an attorney during a claim has dropped from 22 percent in 2015 to 7 percent in 2019. (That figure is likely to increase to roughly 12 percent due to ongoing 2019 claims that have not settled/closed.) Using an attorney who knows the industry can save an operator money.
DATA AND INSURANCE PREMIUMS
The data on claim rates and claim amounts indicate that, on average, an operation with 10,000 annual participants will have $720,000 in claims over a 10-year period. Insurance companies see your premiums as “funding” for the $720,000 in claims that will likely occur over that 10-year period. That is part of the calculation that goes into setting insurance rates.
Further, the insurance industry has endured a “hard market” over the past three years, which has led to a rise in insurance rates. We are hopeful that the market has peaked, and that quarterly increases will start decreasing. When evaluating your renewal for this year, though, keep in mind that the average annual premium increase for all businesses in the U.S. was 22 percent in the fourth quarter of 2020. While this hard market is not specific to the adventure park industry, we are experiencing the same trend.


